


Most field service operations I work with run somewhere between 40 and 200 assets. HVAC units, generators, pumps, compressors, vehicles—whatever keeps the operation moving. Maintenance budgets usually fall around 8-12% of annual revenue, which sounds reasonable until you realize that money gets spread evenly across everything, regardless of which failures actually hurt you.
The disconnect is obvious once you see it: your backup generator failing in July is annoying. That same generator failing during a winter storm when you're servicing critical infrastructure? That's a contract violation, potential liability, and real reputation damage. Most maintenance schedules treat both scenarios the same way.
The companies that figure this out—the ones running older equipment with surprisingly few critical failures—they've stopped relying on manufacturer recommendations and started scoring assets based on actual business impact. They know exactly which 20% of their fleet carries 80% of the risk, and they allocate resources accordingly.
Why traditional PM schedules fail mixed fleets
Traditional preventive maintenance comes from manufacturing environments—rows of identical machines doing identical work. That model makes sense there. Field service fleets are a different animal.
Take a typical HVAC company. Three bucket trucks, same model. One services hospitals, one handles residential calls. The failure consequences are completely different. The hospital truck going down means rescheduling maintenance on life safety systems. The residential truck? You shuffle some appointments, maybe grab a rental for a few days.
Then there's the age problem. Most fleets span 10-15 years of equipment purchases. The five-year-old excavator needs different attention than the one you bought last year, or the 2012 workhorse that somehow keeps running. Manufacturer schedules assume everything's new. Reality doesn't work that way.
What really breaks one-size-fits-all PM is utilization variance. That specialized bore inspection camera might be worth $85,000, but if it only runs twice a month, it probably doesn't need the same maintenance frequency as your $12,000 daily-driver service van. Yet plenty of companies religiously maintain low-use specialty equipment while their bread-and-butter assets quietly deteriorate.
The financial hit compounds. Over-maintaining low-risk assets wastes somewhere around $800-1,200 per unit annually in unnecessary service. Under-maintaining critical ones? One catastrophic failure can wipe out six months of maintenance budget between downtime, emergency repairs, and lost contracts.
The hidden multiplication effect of critical failures
When a critical asset goes down, the damage spreads well beyond repair costs. A commercial refrigeration company lost their main reefer truck during peak summer season. The repair bill was $8,500. The actual cost ended up north of $47,000 when you add:
Eliminate field service chaos with Romrly.
Romrly helps you assign, track, and complete service jobs efficiently and on time.
- Unified job scheduling
- Technician dispatch & tracking
- Customer notifications & updates
No credit card required
-
Contract penalties that kicked in after 48 hours.
-
Three restaurant clients threatening to leave.
-
A replacement rental at emergency rates—triple normal cost.
-
Two techs idle for a full day waiting on that rental.
-
Six hours of dispatcher time reshuffling the entire week's schedule.
-
And customer confidence that took months to rebuild.
This multiplication effect varies a lot depending on timing and asset type. A lift breaking in January might cost $3,000 all-in. That same lift failing during your busiest season when you're already stretched thin? Could run $15,000 or more in cascading impacts.
Geographic coverage makes it worse. Territory-based operations where each truck covers specific zip codes don't just lose capacity when a vehicle goes down—they lose an entire territory unless they pull resources from somewhere else. Then service levels drop across the board while you play catch-up.
The staffing piece often gets overlooked. Specialized equipment usually means specialized operators. When a high-reach aerial lift breaks down, you're not just fixing the lift—you've got a certified operator sitting around, getting paid to not work, while customers wait. At $65-85 per hour for skilled operators, that idle time adds up fast.
Building your risk scoring matrix
The scoring system needs to be simple enough that your maintenance supervisor can calculate it on a napkin, but detailed enough to capture real operational risk. Here's the framework that holds up across different fleet types:
Component 1: Failure Impact Score (1-5 scale)
-
5
Immediate safety risk or regulatory violation
-
4
Service stoppage affecting contracted SLAs
-
3
Significant operational disruption (multiple crews affected)
-
2
Single crew disruption with a workaround available
-
1
Minor inconvenience, backup options exist
Component 2: Replacement Difficulty Score (1-5 scale)
-
5
Custom equipment, 4+ week lead time
-
4
Specialty item, 2-3 week lead
-
3
Standard but expensive, 1-2 week lead
-
2
Standard equipment, 3-5 day lead
-
1
Off-the-shelf, same-day availability
Component 3: Revenue Dependency Score (1-5 scale)
-
5
Directly generates >$10k weekly revenue
-
4
Directly generates $5k-10k weekly
-
3
Supports $2k-5k weekly revenue
-
2
Supports <$2k weekly revenue
-
1
Indirect revenue support only
Component 4: Failure Probability Modifier (0.5-2.0 multiplier)
-
2.0
Known issues, past failure history, age >80% of useful life
-
1.5
Showing wear signs, age 60-80% of useful life
-
1.0
Normal condition, age 40-60% of useful life
-
0.75
Good condition, age 20-40% of useful life
-
0.5
Excellent condition, <20% of useful life
Total Risk Score = (Impact + Replacement + Revenue) × Probability Modifier
This produces a score between 1.5 and 30. Anything above 20 is critical. 12-20 is important. 6-12 is standard. Below 6 is minimal.
When in doubt, involve a senior tech for the probability modifier — they're often the best source of informal failure history.
Here's a simple visual to help teams adopt the scoring workflow.
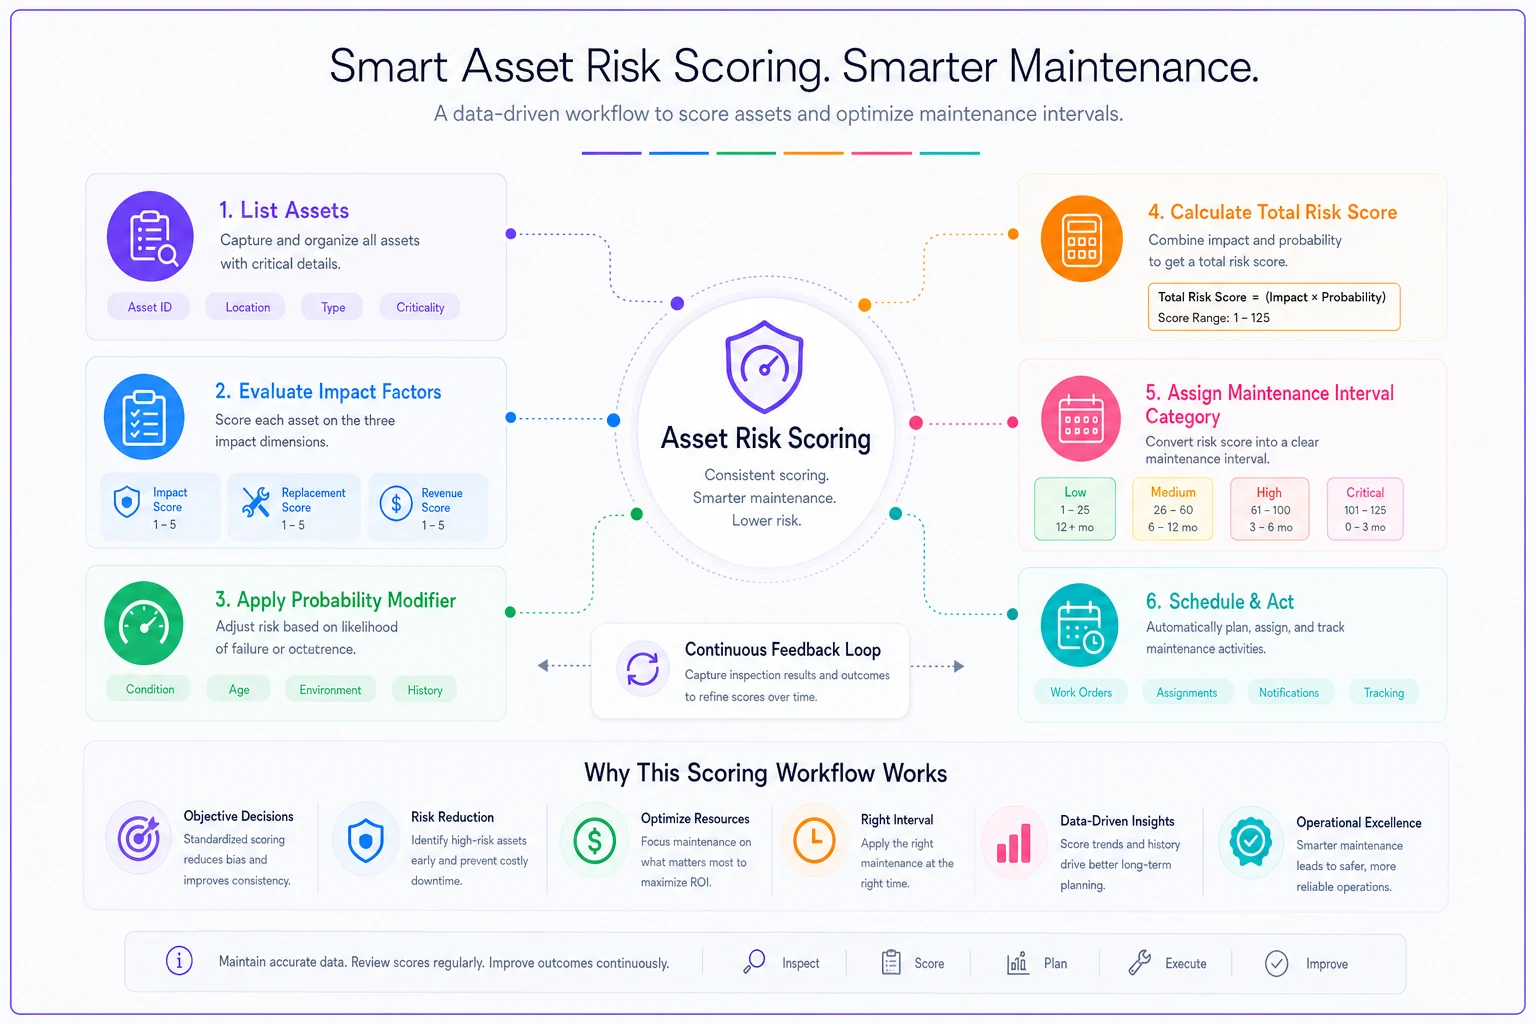
Keep the graphic visible near your planning board so scoring becomes an everyday activity rather than a once-a-year exercise.
Real scoring walkthrough: three different assets
Here's how this plays out with actual assets from a commercial generator service company:
Asset 1: Primary mobile generator trailer (2018 model, 500kW)
-
Failure Impact
4 (multiple customer outages during storm season)
-
Replacement Difficulty
4 (specialty rental, limited availability)
-
Revenue Dependency
5 (generates ~$12k/week during outage season)
-
Probability Modifier
1.5 (showing age, had a breakdown last year)
-
Total Score
(4+4+5) × 1.5 = 19.5
This unit gets monthly PMs, quarterly deep inspections, and annual overhauls. Borderline critical.
Asset 2: Diagnostic laptop with proprietary software
-
Failure Impact
2 (one tech affected, can share others)
-
Replacement Difficulty
3 (software licensing takes about a week)
-
Revenue Dependency
2 (supports but doesn't directly generate revenue)
-
Probability Modifier
0.75 (two years old, no issues)
-
Total Score
(2+3+2) × 0.75 = 5.25
Basic quarterly checks, annual software updates. Not worth obsessing over.
Asset 3: Boom truck for generator installation
-
Failure Impact
3 (installations get delayed, not emergency work)
-
Replacement Difficulty
3 (rental available but expensive)
-
Revenue Dependency
4 (installation revenue ~$8k/week)
-
Probability Modifier
2.0 (12 years old, hydraulic issues starting)
-
Total Score
(3+3+4) × 2.0 = 20
Just crossed into critical territory. Time to increase PM frequency or seriously plan replacement.
Scores also shift seasonally. That generator trailer might be 19.5 during storm season and drop closer to 12 during calm months. Operators who adjust PM schedules to reflect that reality get better results than those who set it and forget it.
Converting scores to maintenance intervals
Scores don't mean much without translating them into actual schedules. Here's the interval mapping that tends to work:
| Category | Operating inspection | Preventive maintenance | Comprehensive service | Complete overhaul |
|---|---|---|---|---|
| Critical Assets (Score 20+) | Weekly | Monthly | Quarterly | Annual |
| Important Assets (Score 12-20) | Bi-weekly | Quarterly | Semi-annual | Every 2 years |
| Standard Assets (Score 6-12) | Monthly | Semi-annual | Annual | Every 3-4 years |
| Minimal Assets (Score <6) | Quarterly | Annual | Every 2 years | As needed |
The mistake is trying to flip the switch all at once. A pumping station service company tried exactly that—went from uniform monthly PMs to risk-based scheduling overnight. Complete chaos. Techs were confused, customers noticed the changes in service patterns, and they actually had more failures in month two than before the switch.
Graduated implementation works better. Start with your top 20% highest-scoring assets. Run enhanced PM schedules just for those while keeping everything else on the old schedule. After 60 days, add the next 20%. This staged approach lets you work out the kinks without disrupting everything simultaneously.
Also worth thinking about: if you're suddenly doing weekly inspections on critical assets, who's doing that work? Most maintenance teams are already running at 85-90% capacity. You might need a part-time PM tech or need to redistribute some routine tasks before ramping up.
Mixed fleet challenges and workarounds
Mixed fleets create unique problems that a scoring matrix alone can't solve.
The diesel versus electric split is particularly awkward. A diesel bucket truck and an electric one might score identically on paper, but their maintenance needs are completely different. Diesel requires oil changes, filter replacements, emissions system maintenance. Electric needs battery health monitoring, cooling system checks, software updates. Same risk score, totally different PM requirements.
Age diversity is another wrinkle. That 2010 backhoe might be rock solid—built before manufacturers got comfortable with planned obsolescence. Meanwhile, your 2019 model with all the electronics breaks if you look at it wrong. Age alone doesn't determine failure probability; you need model-specific history, not just a number.
The rental versus owned question complicates scoring too. If a significant chunk of your fleet is rented, those assets still affect operations when they fail even though you don't control the maintenance. Scoring rental equipment at around 50% weight usually makes sense—enough to track the risk without pretending you have control you don't.
Seasonal equipment is its own puzzle. Snow plows, leaf vacs, pool service equipment—sitting for eight months, then running constantly for four. Whether you maintain year-round or just pre-season usually comes down to replacement difficulty. Hard-to-replace seasonal assets get year-round attention. Commodity items get pre-season prep and not much else.
The workaround that holds up best across mixed fleets is subset scoring. Score similar assets against each other first, then normalize across the full fleet. All vehicles get scored 1-30 against other vehicles, then you apply a category modifier to compare vehicles against generators against tools. It's a bit more work upfront, but the resulting priority list actually makes sense.
ROI calculation framework
The business case for risk-based PM comes down to prevented failures versus program cost.
Baseline Failure Cost (Annual)
-
Track for one year before implementation
-
Number of critical asset failures × average total cost per failure
-
Number of important asset failures × average cost
-
Number of standard asset failures × average cost
For a typical 50-asset operation, this usually totals somewhere between $45,000-85,000 annually, with roughly 70% coming from critical asset failures.
Risk-Based PM Investment
-
Additional PM labor hours × hourly rate
-
Increased parts and consumables
-
Training and setup time
-
Software or tracking systems
This typically adds $12,000-20,000 to annual maintenance spending for the same 50-asset operation.
Failure Reduction Factors
-
Critical assets
~70% failure reduction
-
Important assets
~50% failure reduction
-
Standard assets
~30% failure reduction
Net ROI Calculation
(Prevented failure costs - Additional PM investment) / Additional PM investment
Most operations see 150-300% ROI within the first year. The key point: you're not necessarily spending more on maintenance overall. You're spending smarter—doing less on low-risk assets while preventing the expensive failures that actually matter.
One electrical contractor tracked every failure for two years—one year before implementing risk-based scoring, one year after. Critical failures dropped from 8 to 2. That alone saved $38,000. Additional PM cost was $11,000. ROI: 245%.
Implementation phases and timeline
Rolling this out takes about 90 days for a typical operation, longer if you're managing multiple locations.
Phase 1: Baseline and Score (Days 1-30)
List every asset. If it costs more than $5,000 or would take more than a day to replace, it goes on the list. Pull failure history for the past 18 months—dates, costs, and downstream impacts.
Score everything using the matrix. This usually takes 2-3 hours per 25 assets with decent records. No records? Budget a full day per 25 assets to research and estimate. Involve your senior techs here. They know which equipment is problematic even when nothing's been documented.
Anything scoring above 20 gets flagged for immediate attention. Document current PM schedules for comparison before you change anything.
Phase 2: Pilot Implementation (Days 31-60)
Pick your top 10 highest-scoring assets for the pilot. Only these get new PM schedules initially. Brief your maintenance team on why these specific assets are getting extra attention—this isn't about what they were doing wrong before, it's about preventing expensive failures.
Set up tracking for pilot assets: PM completion rates, time per PM, issues found, any failures that still occur. A spreadsheet is fine at this stage.
Run the pilot for 30 days and don't change anything else. Same techs, same parts inventory, same everything except PM frequency on those 10 assets.
Phase 3: Graduated Rollout (Days 61-90)
If the pilot works—and it usually does—add your next 20% of assets by score. Adjust PM schedules for this batch while keeping the original 10 on their new schedule.
Start reducing PM frequency on your lowest-scoring assets. This frees up capacity for the increased attention going toward critical equipment. You're not abandoning these assets, just right-sizing the effort.
Update documentation and train remaining staff. By day 90, everyone should understand the scoring system and what intervals apply to their equipment.
Phase 4: Optimization (Days 91+)
After three months, review the failure data. Did critical assets fail less? Did low-priority assets start failing more? Adjust scores and intervals based on actual results.
Some initial scores will be wrong. That's expected. The diagnostic laptop you scored as minimal might turn out to be critical because it's the only device with certain software licenses. Adjust and move on.
Building your rollout checklist
Pre-Launch Preparation
-
Complete asset inventory with serial numbers, purchase dates, current hours/miles
-
Gather 18 months of maintenance and failure records
-
Calculate baseline failure costs by asset
-
Score all assets using the risk matrix
-
Identify top 20% critical assets
-
Calculate required PM capacity for new intervals
-
Determine if additional maintenance staff is needed
-
Order additional PM parts and supplies for higher-frequency assets
-
Create before/after PM schedule comparison chart
Stakeholder Communication
-
Brief maintenance team on scoring methodology
-
Explain changes to dispatch and scheduling team
-
Prepare customer communication if service patterns will visibly change
-
Set expectations with operations on pilot timeline
-
Document decision process for future reference
Pilot Launch
-
Create PM work orders for pilot assets at new intervals
-
Set up failure tracking specific to pilot assets
-
Assign a dedicated tech if possible for consistency
-
Schedule weekly check-ins for the first month
-
Document time per PM task for capacity planning
Monitoring and Adjustment
-
Weekly review of PM completion rates
-
Track any failures on high-priority assets
-
Monitor technician feedback on PM frequency
-
Calculate monthly prevented failure value
-
Adjust scores based on actual failure data
-
Document lessons learned for broader rollout
Full Implementation
-
Gradually add assets in 20% increments
-
Reduce PM on lowest-scoring assets to free capacity
-
Update maintenance software with new intervals
-
Create score review schedule (quarterly recommended)
-
Build reporting dashboard for ongoing monitoring
Use this checklist as a living document—update it as you learn what works in your operation.
When to recalculate your scores
Scores aren't permanent. Equipment ages, business priorities shift, and operational patterns change.
Quarterly reviews work for most operations. It takes about an hour to go through your top 20% of assets and check whether anything's changed. Did the generator you were worried about prove more reliable than expected? Has a backup vehicle become primary because the main truck keeps having issues?
Some events warrant immediate rescoring:
-
Any major failure on an asset (the probability modifier clearly needs updating)
-
Change in primary use—backup equipment becoming the primary workhorse
-
New contract requirements with stricter SLAs that raise impact scores
-
Seasonal transitions (storm season, construction season, etc.)
-
Age milestones, particularly crossing 80% of expected useful life
Business growth changes the picture too. When you jump from 50 to 75 assets, your entire risk profile shifts. What was critical before might drop to important because you now have redundancy. Or that specialty tool you barely used becomes critical because you landed a contract that actually requires it.
Market conditions matter more than most people account for. When replacement parts get scarce or prices spike, your replacement difficulty scores need updating across the board. During the supply chain disruptions in 2021-2022, items that were typically 2s or 3s jumped to 4s and 5s almost overnight.
Software integration and automation opportunities
Most operations start tracking this in spreadsheets, which works fine for the first year. But keeping accurate scores and schedules current for 50+ assets gets unwieldy fast.
The tedious part isn't calculating initial scores—it's keeping them accurate over time. Operational software with built-in AI automation can track failure patterns and flag when an asset's probability modifier should shift, so you're not waiting for quarterly reviews to catch something that's already trending toward failure.
PM scheduling is another area where automation helps. Once you've set score-based intervals, the software can generate work orders automatically, assign them based on technician skills, and optimize routes when multiple assets need service in the same area. That removes the administrative load that makes risk-based PM hard to sustain long-term.
The more interesting value comes from pattern recognition across the full fleet. AI-powered platforms can identify which assets tend to fail in sequence, which PM tasks actually prevent failures versus which ones just check boxes, and which technicians tend to catch problems before they escalate. That kind of insight turns maintenance from reactive into something closer to genuinely predictive.
Integration with parts inventory means you're rarely caught without critical spares for high-risk assets. The system knows your boom truck is approaching critical status and makes sure hydraulic seals are already in stock—no emergency parts runs eating into maintenance windows.
Measuring success and continuous improvement
After six months of risk-based PM, you should see measurable shifts. Key metrics to track:
Failure Rate Changes
-
Critical asset failures should drop 60-75%
-
Important asset failures should drop 40-50%
-
Standard asset failures might tick up slightly (acceptable)
-
Overall failure costs should decrease 35-50%
PM Efficiency Metrics
-
PM completion rate (target
>95% for critical, >90% for important)
-
Issues caught during PM versus emergency failures (should shift toward PM discovery)
-
Average time per PM task (should drop as techs get familiar with patterns)
-
PM labor hours as a percentage of total maintenance hours (should increase)
Financial Indicators
-
Emergency repair costs (should decrease 40-60%)
-
Overtime hours for emergency response (should drop significantly)
-
Rental equipment costs (should decrease as reliability improves)
-
Lost revenue from asset downtime (usually the biggest improvement)
There are less obvious wins too. Your maintenance team's stress levels drop when they're not constantly reacting to crises. Customers notice when critical equipment stops failing during peak demand. Operations can actually plan work with some confidence that assets will be available.
Watch for overcorrection. Some teams get so focused on preventing critical failures that they start overmaintaining everything that scores above 15. That defeats the purpose. The goal is appropriate maintenance, not maximum maintenance.
The continuous improvement cycle is simple: Score → Implement → Measure → Adjust → Repeat. Every quarter, you're getting smarter about which assets actually matter and which PM tasks actually prevent failures. After a year, your maintenance operation looks very different from where you started—in a good way.
From reactive to strategic maintenance
Prioritizing preventive maintenance isn't really about maintenance at all. It's about knowing which assets drive your business and protecting them accordingly. The scoring rubric just gives you a systematic way to make those calls instead of going with gut feel or defaulting to whatever the manual says.
Most operations start by treating all assets equally—because it seems fair, because it's what they've always done, or because nobody ever sat down and asked which failures actually matter. The ones that get ahead realize pretty quickly that when your hospital data center generator and your shop's backup air compressor are on the same PM schedule, something's off in your risk thinking.
The rubric and rollout process here isn't perfect for every operation. But it's a starting point that holds up across a lot of different fleet types and business contexts. The core question is always the same: if this asset fails, what actually happens to my business? Answer that honestly for each asset, and the rest is math and follow-through.
Most operations see payback within four to six months just from prevented critical failures. The longer-term benefit is treating maintenance as a strategic function rather than a cost center. While competitors deal with emergency breakdowns, you're running 95%+ availability on the assets that matter most.
Fleets aren't getting simpler. Equipment is getting more complex, more expensive, and harder to replace quickly. The operations that build disciplined, systematic approaches to maintenance now will be in a much stronger position as fleets diversify further and the cost of downtime keeps climbing.
Ready to optimize your field operations?
Join 2,000+ service teams using Romrly to boost productivity, reduce downtime, and enhance customer satisfaction.