


Running field service capacity planning feels like solving three equations at once. You're balancing regular maintenance schedules against emergency calls, figuring out when overtime costs less than a contractor, and somehow predicting next quarter's demand spikes based on last year's weather and this year's construction activity.
Most field service companies handle this with gut feel and spreadsheets that haven't been touched since 2019. Then August hits with 40% more calls than normal, your best tech quits, and you're scrambling for contractors who actually show up while your crew racks up 60-hour weeks.
The real problem isn't the surge itself — it's that every surge feels like the first one because nothing from last time ever got turned into rules for next time.
Why capacity planning breaks down in field service
Field service capacity planning breaks differently than other industries because demand arrives from multiple directions at once. You've got preventive maintenance that's supposedly predictable, warranty work that clusters around installation dates, emergency repairs that follow equipment age curves, and seasonal patterns that shift based on weather, construction cycles, and whether the local factory is running three shifts or two.
Traditional capacity models assume you can smooth demand or control arrival rates. Field service can't. When an HVAC system fails in July or pipes freeze in January, customers need service now. You can't defer that demand the way a warehouse can delay shipments or a restaurant can push reservations.
The math gets messier because your capacity isn't fixed either. A senior tech might handle twice the daily volume of a junior tech, but only for certain job types. Contractors cost more per job but can save you on overtime. Some techs work faster solo; others are more productive with a partner. Your actual capacity on any given day depends on who's available, what vehicles are running, which parts are in stock, and whether traffic is cooperating.
What really kills most capacity plans is the feedback loop. When you're understaffed, service quality drops. Jobs take longer. Callbacks increase. First-time fix rates fall. Each callback eats capacity you don't have, creating more delays, more complaints, and eventually more turnover when techs burn out from constant pressure.
Demand profiles reveal patterns you're missing
Most field service managers track total job volume and maybe break it out by service type. That's like navigating with only longitude — you're missing half the picture. Real demand profiling requires multiple dimensions analyzed together.
Eliminate field service chaos with Romrly.
Romrly helps you assign, track, and complete service jobs efficiently and on time.
- Unified job scheduling
- Technician dispatch & tracking
- Customer notifications & updates
No credit card required
Start with temporal patterns beyond just "busy season." Map demand by day of week, time of day (2-hour blocks work well), week of month, holiday adjacency, school calendar alignment, and local event schedules.
One commercial HVAC company discovered their Monday morning surge wasn't random — it was businesses finding out about weekend equipment failures. By offering discounted Sunday diagnostic visits, they shifted roughly 30% of Monday emergency calls to scheduled Sunday work, cutting overtime while actually improving customer satisfaction.
Geographic clustering matters more than most operations realize. Plot service calls by location and time. Patterns show up pretty quickly:
-
Industrial areas surge mid-week
-
Residential emergencies cluster on weekends
-
Certain ZIP codes consistently generate complex repairs
-
Some territories have seasonal swings others simply don't
Service complexity profiling changes everything about capacity planning. Track:
-
Average duration by job type and customer segment
-
Parts requirements and probability of needing to order
-
Likelihood of requiring senior tech expertise
-
Equipment needs beyond standard truck stock
-
Historical callback rates by issue type
One elevator service company built profiles showing that modernization projects in buildings over 20 years old had 3x the callback rate of newer buildings. They started automatically scheduling follow-up visits two weeks after modernization jobs, catching issues before they became emergencies and reducing customer escalations by around 40%.
The crew-mix decision matrix nobody teaches
Every field service manager faces the same question weekly: when do we pay overtime versus calling contractors? Most make this call based on whoever complains loudest or whatever happened last time. There's actually straightforward math that makes this decision clearer.
Build a decision matrix with these factors:
| Factor | Weight | Overtime Favors | Contractor Favors |
|---|---|---|---|
| Time sensitivity | 25% | Next-day service OK | Same-day required |
| Technical complexity | 20% | Specialized knowledge needed | Standard procedures |
| Customer relationship | 20% | Key account / warranty work | One-time service |
| Duration | 15% | Under 2 hours | Over 4 hours |
| Geographic location | 10% | Central territory | Remote area |
| Parts availability | 10% | Special order required | Standard inventory |
The calculation gets more interesting when you factor in hidden costs. Overtime isn't just 1.5x hourly rate. Add increased error rates after 50 hours/week, higher injury risk during extended shifts, burnout impact on the following week's productivity, and potential union grievances or labor law exposure.
Contractor costs extend beyond their invoice too. Quality control time and rework, customer satisfaction impacts, administrative overhead for vetting and managing them, training time for your procedures, and liability and insurance considerations all factor in.
A Midwest plumbing operation built rules from this matrix: contractors handle all residential calls beyond 15 miles from their hub, all non-warranty drain cleaning, and overflow during predicted surge periods. Internal crews focus on commercial accounts, warranty work, and complex diagnostics. The result was a roughly 20% reduction in overtime costs while holding a 4.8-star average.
The thing most operations miss is that the decision isn't really overtime OR contractors. Smart shops maintain a hybrid model with clear escalation triggers. When utilization hits 85% for two consecutive days, contractors get activated for specific job types. When it drops below 70%, contractors get stood down with 24-hour notice.
Surge activation triggers that actually work
Surge planning fails because companies wait until they're drowning before reacting. By then, good contractors are booked, your team is exhausted, and customers are already angry. Effective surge response needs preset triggers that fire automatically — not a committee meeting during the crisis.
First-level triggers (Yellow status) — daily completion rate drops below 90%, average response time exceeds SLA by 20%, overtime exceeds 15% of total hours for 3 consecutive days, callback rate increases 25% above baseline, or three or more techs call in sick.
-
Alert contractor network about potential activation
-
Postpone all non-critical preventive maintenance
-
Offer voluntary overtime to qualified techs
-
Accelerate parts orders for common repairs
-
Review upcoming schedule for deferrable work
Second-level triggers (Orange status) — backlog exceeds 3 days of capacity, customer complaints increase 50% week-over-week, overtime exceeds 25% of hours, first-time fix rate drops below 75%, or weather forecast shows extreme conditions.
-
Activate top-tier contractors for overflow
-
Implement emergency dispatch protocols
-
Defer all training and internal meetings
-
Authorize expedited parts shipping
-
Deploy office staff with field experience
-
Communicate proactively with customers about delays
Third-level triggers (Red status) — backlog exceeds 5 days of capacity, you cannot meet emergency response SLAs, multiple techs are approaching 60-hour weekly limits, or key equipment failures are compounding staffing issues.
Red is full surge mode. All qualified contractors get activated, executive team gets directly involved in dispatch decisions, customer communications shift to emergency messaging, geographic restrictions on service get evaluated, and temporary suspension of non-critical services gets considered.
Use this flowchart to visualize trigger levels and the actions each level requires.
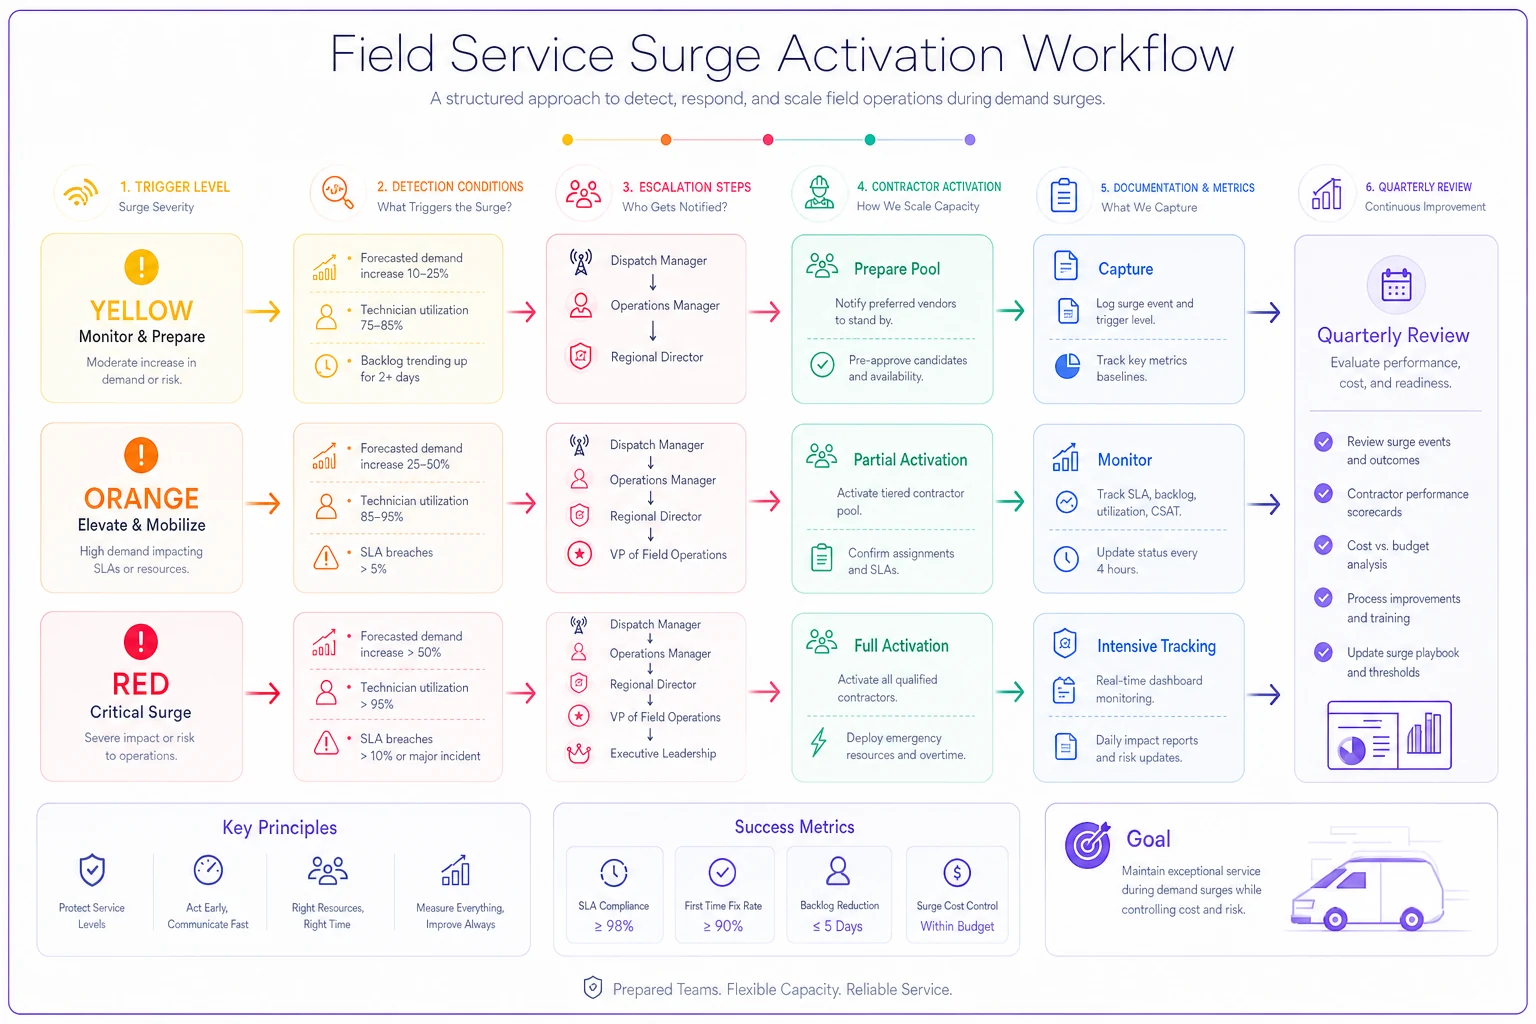
Time-stamp every activation and log the resources and costs immediately to simplify quarterly review.
What separates functional surge response from chaos is documentation. Every activation should generate a trigger timestamp with metrics, resources activated and costs incurred, decisions made and the reasoning behind them, customer impact metrics, and a recovery timeline against actuals.
The quarterly surge review that prevents next quarter's crisis
Most companies treat surges like natural disasters — unpredictable and unpreventable. In reality, the majority of capacity crunches follow patterns. The quarterly review is what turns hindsight into foresight.
Pattern Recognition Analysis
Map every surge event from the past quarter against the previous year's same period, known seasonal factors, local construction permits pulled, weather patterns versus historical averages, major customer facility changes, and equipment installation dates from 3-5 years ago (warranty expiration timing matters more than people think).
One HVAC company noticed surges consistently hit 2-3 years after new subdivision development. They now track construction permits and proactively market maintenance agreements in aging subdivisions before the warranty repair surge arrives.
Response Effectiveness Scoring
-
Detection speed (hours from trigger to recognition)
-
Activation speed (hours from recognition to response)
-
Resource efficiency (overtime hours per job completed)
-
Quality maintenance (callback rate during surge)
-
Financial impact (margin degradation)
-
Customer impact (NPS score change)
-
Team impact (turnover in the following month)
Score each 1-10 and focus improvement on the two lowest scores.
Capacity Model Calibration
Planning assumptions drift over time. Recalculate actual jobs per tech per day by type, drive time ratios by territory and time of day, first-time fix rates by tech experience level, contractor productivity versus internal team, and part availability impact on completion rates. Anything off by more than 15% from your planning assumptions needs immediate adjustment.
Investment Decision Framework
Every surge teaches you where to invest. Calculate the ROI of adding permanent headcount versus contractor relationships, upgrading tools or fleet to improve productivity, training programs to increase tech versatility, technology to improve dispatch efficiency, and inventory investment to reduce parts delays.
Building repeatable decision rules from surge lessons
The gap between good and great field service operations is whether surge lessons become systematic improvements or just war stories. Converting experience into rules takes discipline.
Create decision rules in this format:
-
IF [specific measurable condition]
-
AND [secondary validation criteria]
-
THEN [exact action to take]
-
BECAUSE [reasoning and past evidence]
-
MONITOR [success metrics]
Example rule from an appliance repair operation: IF daily residential service requests exceed 120% of normal Tuesday-Thursday average AND weather forecast shows temperatures above 95°F for the next 3 days, THEN activate overflow contractors for all non-warranty dishwasher and washing machine repairs, BECAUSE analysis shows these repair types have the lowest customer satisfaction impact when serviced by contractors and represent about 35% of heat-related surge volume. MONITOR contractor callback rate stays below 8%.
Document exceptions aggressively. When rules don't work, understand why. Was the trigger threshold wrong? Did conditions change since the rule was created? Were there hidden dependencies nobody accounted for? Did execution deviate from the plan?
Good operations maintain a decision log during surges. Every deviation from standard procedure gets logged with timestamp, decision maker, reasoning, and outcome. That log becomes invaluable for quarterly reviews and for training new managers who weren't there when things went sideways.
The templates that make this system operational
Theory without templates stays theoretical. Here's what actually needs to exist in your operations folder.
Daily Capacity Dashboard Template — current day completion rate, rolling 3-day average utilization, overtime hours trending, contractor hours used, backlog aging analysis, first-time fix rate, and key customer SLA status.
Surge Activation Checklist For each trigger level, you need specific metrics to check, a notification list with contact methods, contractor activation sequence, customer communication templates, internal communication requirements, resource reallocation priorities, and documentation requirements.
Crew-Mix Decision Calculator A simple spreadsheet with overtime cost inputs (base rate, multiplier, overhead), contractor cost inputs (hourly rate, markup, management overhead), job characteristic scoring, automatic recommendation based on weights, and historical accuracy tracking.
Quarterly Review Template
-
Executive summary (3 bullets max)
-
Surge event inventory with triggers and responses
-
Pattern analysis with charts
-
Response effectiveness scorecard
-
Capacity model variance analysis
-
Proposed rule changes with justification
-
Investment recommendations with ROI
-
Action items with owners and dates
Contractor Activation Agreement Template — activation notice requirements, rate structures for different urgency levels, quality standards and penalties, insurance and licensing requirements, training and certification needs, and performance metrics and review schedule.
Where AI-powered operations platforms change the equation
Manual capacity planning relies on Thursday afternoon spreadsheet updates and Monday morning gut checks. By the time you spot a problem, you're already in it.
AI-powered operational platforms change how field service capacity planning works in ways that are genuinely hard to replicate manually. These systems analyze demand patterns across dozens of variables simultaneously — spotting correlations a spreadsheet review would never catch, like how school vacation weeks affect commercial service demand or how construction permits filed six months ago predict current repair surges.
The practical advantage comes from automatic trigger monitoring. Instead of hoping someone checks the right dashboard at the right time, the platform continuously evaluates capacity status against preset rules. When triggers hit, notifications fire immediately, contractors get alerted, and schedules start adjusting before anyone's even opened their email.
Predictive modeling goes further than historical pattern matching. AI-assisted platforms can incorporate weather forecasts, local event schedules, and economic indicators to anticipate demand shifts before they hit. One platform helped a pool service company combine weather forecasts with school calendar data to achieve roughly 85% accuracy on weekly demand forecasting — which sounds modest until you realize how much labor cost that accuracy saves.
The continuous improvement loop also accelerates. Every surge event, every contractor deployment, every overtime decision feeds back into the model. What took a full quarter to learn through manual review can surface in weeks through automated pattern recognition.
During an active surge, the decision support piece matters most. When you're managing a crisis in real time, you don't have bandwidth for spreadsheet analysis. Good AI-powered platforms surface real-time recommendations — which contractors to activate, which jobs to defer, which customers need a heads-up call — and they get sharper with each event as they learn your operation.
Making field service capacity planning sustainable
Building a capacity planning system feels overwhelming when you're already underwater. Start where you have the most pain and build incrementally.
Begin with basic demand profiling. Even simple day-of-week and time-of-day analysis will surface patterns you can act on. Add geographic and complexity dimensions once you're comfortable with the basics.
Develop three surge triggers to start. Don't try to cover every scenario — focus on the situations that hurt most. One electrical contractor started with just "callbacks exceed 15%" as their single trigger. That one rule caught about 80% of their capacity problems early enough to respond effectively.
Test your crew-mix decision matrix on paper before committing to it. Track what you would have decided using the matrix versus what you actually decided. Refine the weights until the matrix matches your best decisions most of the time.
Run your first quarterly review focused on just the last major surge event. Deep understanding of one event beats shallow analysis of many. Use what you learn to handle the next surge better.
The field service KPI framework provides the performance metrics foundation this system builds on — turning measurement into prediction and response. The modular field service operations playbook gives you the SOP structure to document and standardize your surge response procedures.
Perfect capacity planning doesn't exist in field service. Equipment fails randomly, weather shifts suddenly, and customers need service when they need it. But the difference between chaos and controlled response isn't perfection — it's having a system that actually learns from what happened and gets a little better each time. Start documenting your surge triggers this week, build your first crew-mix decision matrix, and schedule that quarterly review. Your future self managing the next surge will be glad you built the playbook now.
Ready to optimize your field operations?
Join 2,000+ service teams using Romrly to boost productivity, reduce downtime, and enhance customer satisfaction.