



Most field service managers track revenue per job. They might even track gross margin. But ask them what their actual per-job profitability looks like after factoring in rework, travel time, overhead allocation, and warranty callbacks? Blank stares.
Running operational software for a commercial HVAC company in Phoenix showed me this up close. They were doing $4.2 million in annual revenue across roughly 8,500 service calls. Looked healthy on paper. Then we built a proper unit-cost model and discovered that 31% of their jobs were actually losing money once you factored everything in. The owner nearly fell out of his chair.
Tracking revenue is easy. Understanding the true cost structure of each job type, customer segment, and service territory—that's the hard part. Without that granularity, you're essentially guessing on pricing decisions and gambling on profitability.
Why traditional job costing fails field service operations
Standard accounting gives you labor costs and parts markup. Maybe you've got a rough overhead percentage you slap on everything. But field service has a messy operational reality that traditional costing methods completely miss.
Take a straightforward commercial refrigeration repair. Your accounting system shows:
-
Tech labor
2 hours at $35/hour = $70
-
Parts
$180 cost, marked up to $270
-
Total cost
$250
-
Billed
$450
-
Margin
$200 (44%)
Looks profitable, right?
But what actually happened: that tech drove 47 minutes each way in stop-and-go traffic. The first repair attempt failed because the wrong part got pulled from inventory. A senior tech had to return three days later to fix it properly. The customer called dispatch four times for status updates. The invoice sat 67 days past due and required two collection calls.
Actual costs were closer to $410—giving you roughly $40 in profit. Less than 9% margin. And that's before allocating any fixed overhead.
This happens because field service has hidden cost drivers that compound on each other. Travel time varies wildly by territory. Callback rates differ by equipment type. Some customers burn through far more support overhead than others. First-time fix rates swing based on parts availability and tech skill level.
Building a finance-to-operations cost model that actually works
After watching dozens of field service businesses struggle with this, the most practical approach I've found is a unit-cost workbook that bridges the gap between your P&L and your operational reality. Not some complex activity-based costing system that requires a PhD to maintain—just a straightforward model that captures the main cost buckets and lets you spot patterns.
Eliminate field service chaos with Romrly.
Romrly helps you assign, track, and complete service jobs efficiently and on time.
- Unified job scheduling
- Technician dispatch & tracking
- Customer notifications & updates
No credit card required
The framework needs five core components mapped to each job.
Direct Labor Costs This goes beyond hourly wages. You need burdened labor rates that include payroll taxes, workers comp, benefits, and PTO coverage. For most field service businesses, the burden multiplier runs between 1.35x and 1.65x base wages. A tech making $30/hour actually costs you $45–50/hour when fully loaded.
Travel and Vehicle Costs Most operations use a flat mileage rate, but that misses the bigger picture. Travel time is lost productivity. In dense urban territories, a tech might complete only 4–5 jobs per day due to traffic. In rural areas, they might drive 200+ miles but still knock out 7–8 jobs because highway miles go fast. You need both time-based and distance-based vehicle costs in your model.
Parts and Materials Beyond purchase cost and markup, you've got carrying costs for inventory, obsolescence writeoffs, and the operational cost of parts runs when techs don't have what they need. Some businesses lose money on certain equipment types purely because parts complexity drives so many return trips.
Overhead Allocation This is where most models fall apart. People either ignore overhead completely or spread it evenly across all jobs. But a complex commercial installation uses far more back-office support than a simple residential repair. Your allocation method needs to reflect actual resource consumption.
Rework and Warranty Costs Nobody tracks this properly. When a job requires a callback, you're not just eating the additional labor and travel costs—you're also destroying tech productivity for other revenue-generating work. In markets with 90-day labor warranties, callback rates above 8% can flip entire service lines from profitable to loss-making.
Real unit-cost calculation with worked examples
Here are three actual job scenarios from a multi-trade mechanical contractor that show how this plays out.
Scenario 1: Standard Commercial HVAC Repair
Revenue: $650 flat rate
Direct costs:
-
Labor
1.5 hours on-site × $48 burdened rate = $72
-
Travel
0.75 hours × $48 = $36
-
Vehicle
34 miles × $0.85/mile = $29
-
Parts
$165 cost + 10% handling = $182
Indirect costs:
-
Dispatch/scheduling
0.25 hours × $28 = $7
-
Overhead allocation (12% of revenue)
$78
-
Warranty reserve (4% of revenue)
$26
Total cost: $430 Gross profit: $220 (33.8% margin)
This looks healthy until you check their average commercial HVAC callback rate, which runs 11%. Factor in one callback for every nine jobs, and the real margin drops to around 24%.
Scenario 2: Emergency After-Hours Residential Call
Revenue: $425 (including emergency fee)
Direct costs:
-
Labor
1 hour on-site × $72 OT rate = $72
-
Travel
1.25 hours × $72 = $90
-
Vehicle
28 miles × $0.85/mile = $24
-
Parts
$45 cost + handling = $50
Indirect costs:
-
After-hours dispatch
$35
-
Overhead allocation
$51
-
Warranty reserve
$17
-
Bad debt reserve (8% for emergency calls)
$34
Total cost: $373 Gross profit: $52 (12.2% margin)
Despite charging emergency rates, the actual margin is terrible. Overtime labor, extended off-hours travel, and higher bad debt rates from emergency customers eat most of it.
Scenario 3: Preventive Maintenance Contract Visit
Revenue: $185 (contracted rate)
Direct costs:
-
Labor
0.75 hours × $48 = $36
-
Travel
0.5 hours × $48 = $24
-
Vehicle
18 miles × $0.85 = $15
-
Parts/supplies
$12
Indirect costs:
-
Scheduling/coordination
$4
-
Overhead allocation
$22
-
No warranty reserve (PM work)
Total cost: $113 Gross profit: $72 (38.9% margin)
The PM visit shows the highest margin percentage but generates the lowest absolute dollar profit. This is the classic field service dilemma—your most profitable work per hour often generates the least total profit per job.
Setting intelligent pricing guardrails based on true costs
Once you understand your real unit economics, you can build pricing guardrails that prevent money-losing work from quietly creeping in. This isn't about having one perfect price for everything—it's about establishing floors that keep you profitable while staying competitive.
One industrial equipment service company I worked with discovered their break-even point for standard repairs was $340 once all costs were included. They'd been quoting jobs at $295 because "that's what the market would bear." No wonder they were fully booked and still struggling.
Minimum pricing thresholds:
-
Standard business hours, existing customer
$385
-
After-hours or weekend
$520
-
New customer, first visit
$425
-
Rural territory (30+ miles)
$445
-
Known problem equipment
$465
They also identified unprofitable patterns and built constraints into their quoting system. Jobs requiring specific obsolete parts automatically triggered a 35% premium. Customers with a history of payment delays got quoted net-15 terms only. Sites with access issues had additional labor time built in upfront.
Not all $400 jobs are created equal. A preventive maintenance visit at a good customer's easily accessible location might generate 40% margin. The same $400 for an emergency repair at a problem customer's remote site could easily lose money. The pricing structure needs to reflect that difference.
Using profitability data to establish SLA boundaries
SLAs become profit destroyers when they're not grounded in unit economics. Field service businesses sign agreements that guarantee response times or resolution windows without ever modeling the true cost of delivering on those promises—and it catches up with them.
A facilities management company had a 4-hour response time SLA with a major retail chain. Seemed reasonable since they had techs throughout the metro area. But when we mapped the actual costs, emergency dispatches to meet that SLA were running $180–220 per incident in disrupted schedules and overtime. The customer was paying a $40/month SLA premium per location. The math was upside down from day one.
Build your SLA tiers around profitability breakpoints:
| SLA Tier | Response Time | Requirements | Minimum Premium |
|---|---|---|---|
| Platinum | 2 hours | Dedicated tech capacity | $450/month + 25% job premium |
| Gold | 4 hours | Priority scheduling | $200/month + 15% job premium |
| Silver | Next business day | Standard queue | $75/month |
| Bronze | 48–72 hours | Batch scheduling | No premium |
The premium structure needs to cover both the direct costs of faster response and the opportunity cost of disrupted schedules. That Platinum tier customer paying $450/month needs to generate enough margin to justify keeping tech capacity available even if they only call twice a month.
For one client, we built a simple decision matrix that automatically recommended SLA tiers based on customer characteristics: annual revenue per customer, average job margin, payment history, geographic location, equipment complexity, and historical callback rate. Customers generating less than $8,000 annually with margins below 25% couldn't qualify for anything above Bronze tier, period. No exceptions. This stopped sales from signing unprofitable SLA commitments just to close deals.
Labor efficiency multipliers most analyses miss
Standard costing assumes techs are productive for their entire scheduled hours. Even well-run field service operations typically see 65–75% wrench time. The rest disappears into travel, paperwork, parts runs, callbacks, and coordination.
But productivity isn't uniform across your workforce. When you dig into technician performance data, clear patterns show up.
Your top 20% of techs typically deliver 35% more billable hours, 60% fewer callbacks, 40% higher invoice values, and 25% better collection rates. Meanwhile, your bottom 20% often operate at negative contribution margins once you factor in rework, supervision time, and customer satisfaction fallout.
This creates a hidden cost multiplication effect. Take a tech earning $28/hour who generates 5.5 billable hours per day with a 12% callback rate. Their true cost per billable hour isn't just their wage divided by productivity: ($28 × 8 hours × 1.5 burden) ÷ (5.5 billable hours × 0.88 first-time fix rate) = $69 per productive hour Compare that to a senior tech at $38/hour who bills 6.5 hours with a 3% callback rate: ($38 × 8 hours × 1.5 burden) ÷ (6.5 billable hours × 0.97 first-time fix rate) = $72 per productive hour
The senior tech costs 38% more in wages but only 4% more per quality billable hour. Deploying junior techs to complex jobs is a profit disaster—you save $10/hour in wages while generating callbacks that cost $200+ each.
Overhead allocation methods that reflect operational reality
Most field service businesses use a flat overhead rate—usually somewhere between 15–25% of revenue. Fine for basic analysis, but it completely distorts profitability by customer and job type.
Think about actual overhead consumption across different work types. A contracted preventive maintenance visit requires minimal overhead. The schedule is set months in advance. No emergency dispatch. No quoting. Minimal customer service touches. Often batch invoiced monthly. These jobs might genuinely consume only 8–10% in overhead.
Compare that to emergency break-fix work: multiple dispatch touches, real-time schedule juggling, customer calls for updates, parts sourcing, priority invoicing, collection follow-up. These jobs can easily burn through 30%+ in overhead resources.
Instead of flat rates, build an allocation model based on job characteristics.
Base overhead: 8% of revenue Covers truly fixed costs—rent, insurance, basic admin.
Variable overhead drivers:
-
Emergency dispatch
+$35 per job
-
After-hours service
+$50 per job
-
New customer setup
+$25 first visit
-
Special parts sourcing
+$20 per incident
-
Payment terms beyond net-30
+2% per month
-
Warranty/callback
+$45 per incident
-
Manual invoicing
+$12 per invoice
-
Customer service touches
+$8 per interaction
One client discovered their "best" customer—a national account generating $400k annually—was actually their least profitable relationship, due to excessive service demands and chronic payment delays. The flat overhead rate had been masking it for years.
The compound impact of rework on true profitability
Callbacks and rework create a profit death spiral that most costing models underestimate. It's not just the direct cost of the return visit. There's a cascade of hidden impacts that multiply the damage.
When a residential HVAC company with 12 techs runs a 15% callback rate, here's what actually happens: 15% of jobs require a second visit (obvious cost), tech confidence drops and slows productivity by 10–15%, dispatch complexity increases by around 25%, customer satisfaction scores drop, online reviews trend negative and drive up customer acquisition costs, senior tech time gets diverted to remedial training, parts inventory accuracy degrades from panic pulls, and warranty reserve requirements climb.
We mapped this for a plumbing contractor doing 6,000 jobs annually. Their 13% callback rate was directly costing $340,000 in additional labor and travel. But the indirect impacts—lost productivity, increased customer churn, higher acquisition costs—pushed the total above $600,000. That's roughly $100 per job in hidden callback costs, whether that specific job had problems or not.
The profitability impact varies dramatically by job type:
| Job Type | Callback Rate | Direct Cost | Total Impact | Profit Erosion |
|---|---|---|---|---|
| Water heater install | 4% | $35 | $78 | -8% |
| Drain cleaning | 7% | $28 | $65 | -12% |
| Emergency repair | 18% | $52 | $143 | -31% |
| Remodel plumbing | 11% | $88 | $234 | -19% |
Emergency repairs might look profitable at 35% gross margin. Factor in the callback impact and true margins drop to single digits. This is why many successful operations either avoid emergency work entirely or price it at seemingly outrageous premiums.
Building your own unit-cost workbook
After implementing various versions of this across different operations, this structure works best for businesses under $20M revenue.
Start with a simple Excel model—don't overcomplicate it with specialized software initially. You need four connected worksheets.
Sheet 1: Cost Driver Inputs Pull your actual costs from accounting and operations: technician wages by level, burden rates (taxes, benefits, insurance), vehicle costs per mile and per hour, overhead costs by category, historical callback rates by job type, and collection loss rates by customer type.
Sheet 2: Job Cost Calculator Build formulas that combine the cost drivers for any given job. You'll want a job type dropdown, territory and distance inputs, technician level assigned, time estimates for travel, on-site, and admin work, a parts cost input field, customer type flags (new, contract, emergency), and SLA tier selection.
Sheet 3: Profitability Analysis Generate three key views: per-job margin (revenue minus all allocated costs), customer lifetime profitability, and technician productivity metrics.
Sheet 4: Pricing Guidelines Translate the cost analysis into actionable pricing rules, including minimum price by job type, territory surcharges, customer risk premiums, SLA tier pricing, and unprofitable work flags.
Here's a quick visual workflow for how the four sheets connect and update.
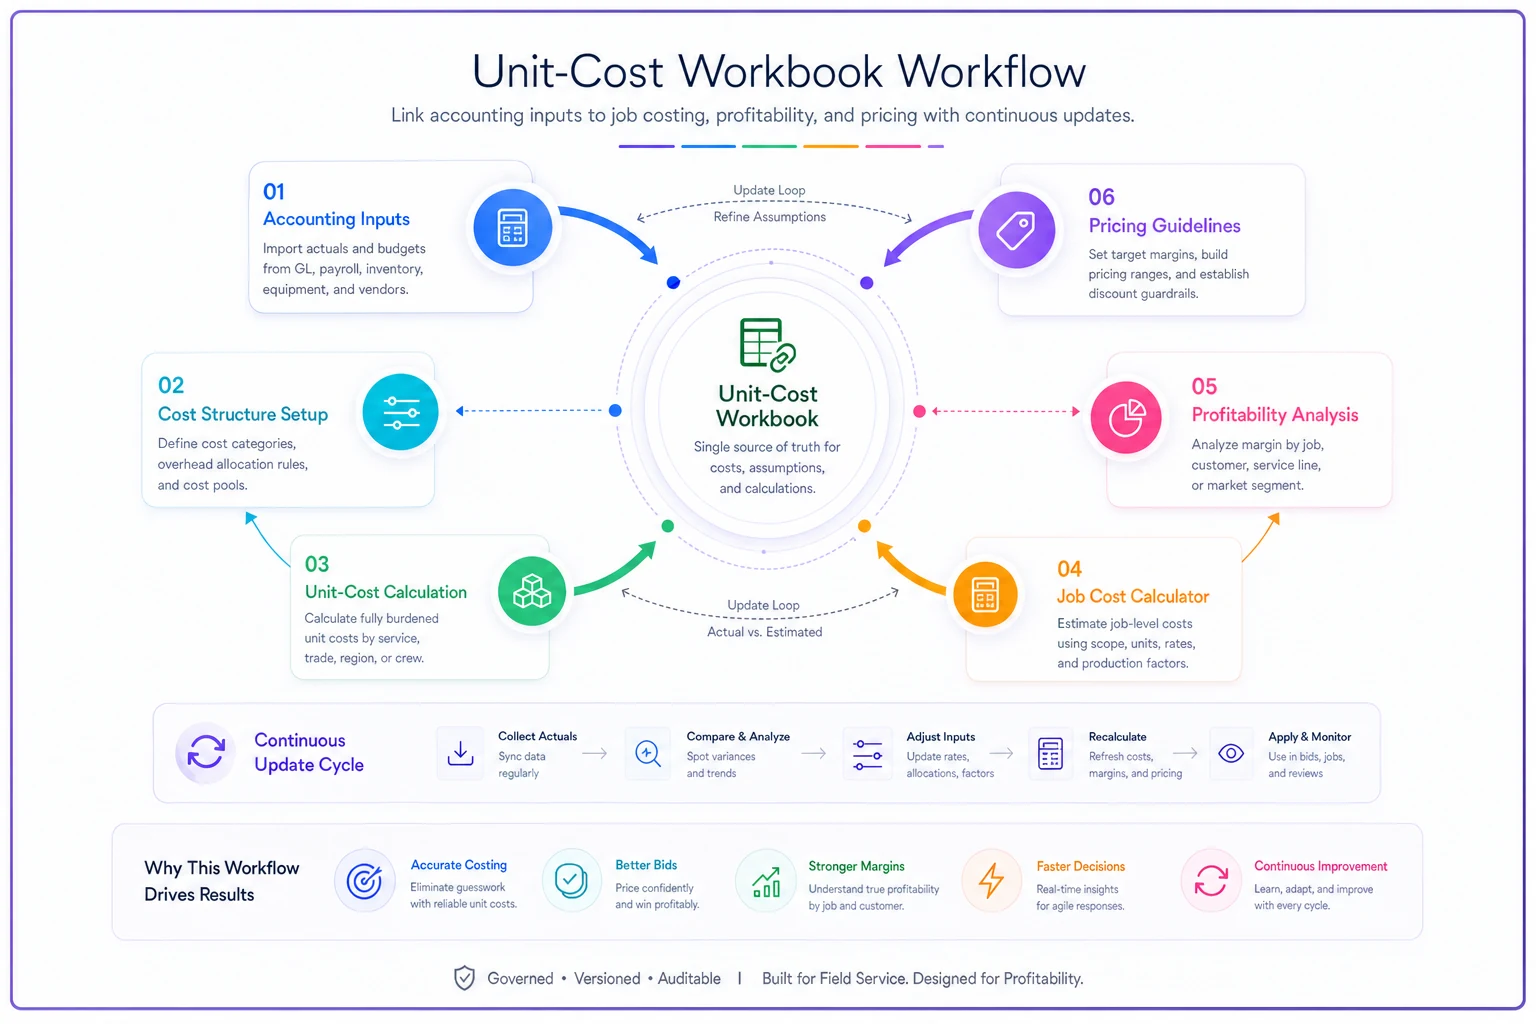
Refresh burden rates, callback percentages, and overhead allocations every quarter to keep the model useful and accurate.
The critical part is keeping it updated. Refresh burden rates, callback percentages, and overhead allocations every quarter based on actual data. Most businesses find their initial estimates off by 20–30% once they start tracking real numbers.
Start with a simple Excel model—don't overcomplicate it with specialized software initially. You need four connected worksheets.
When this framework breaks and what to do about it
This unit-cost approach works well until you hit certain scale points—usually around $15–20M revenue or 50+ field technicians.
The breakdown points are pretty predictable. Shared resource allocation gets messy when you have dedicated dispatch for commercial vs. residential, or specialized coordinators for certain accounts. Job variety explodes once you're servicing 10+ equipment types across multiple trade specialties, and maintaining accurate cost factors for every permutation becomes a full-time job. Geographic complexity multiplies across multi-branch operations with different wage scales, vehicle costs, and productivity levels. And enterprise accounts negotiate custom terms that don't fit standard categories—dedicated technicians, guaranteed response times, special pricing matrices.
This is honestly where purpose-built operational software becomes essential. Not just financial software that tracks costs, but operational platforms that connect field activity to financial outcomes in real-time.
The AI automation layer becomes genuinely valuable here for pattern recognition across thousands of jobs. Instead of manually updating callback rates quarterly, the system tracks them daily and adjusts cost projections automatically. When a specific equipment type starts showing increased failure rates, the pricing model adapts before you take losses. Remote diagnostics data feeds can even flag which jobs are likely to require callbacks before you dispatch—letting you send the right tech the first time.
Making profitability data drive operational decisions
Understanding per-job profitability shouldn't just inform pricing. It should reshape how you run the whole operation.
A commercial refrigeration company found through unit-cost analysis that grocery store work generated 42% margins while restaurant work barely broke even at 8%. Same equipment, same techs, completely different profitability. The difference? Grocery stores did preventive maintenance, provided easy access, and paid on time. Restaurants called for emergencies, had cluttered equipment rooms, and routinely stretched payment to 60+ days.
Instead of trying to fix restaurant profitability through higher prices—restaurants weren't going to pay grocery store rates—they restructured. A separate quick-response team for restaurant work using junior techs and older vehicles. Standardized equipment brands to reduce parts complexity. Credit cards on file required for all restaurant customers. Margin improved to 22% within six months.
Another client used profitability data to reshape their territory strategy entirely. Jobs more than 35 miles from the shop lost money 70% of the time, regardless of what they charged. But those same distant territories became profitable when they batched four or more jobs on the same day. So they restructured from geographic territories to day-based zones—north county on Mondays and Thursdays, south on Tuesdays and Fridays, metro core on Wednesdays. Customer satisfaction actually improved because they could offer tighter scheduling windows.
Profitability data becomes most valuable when it drives operational changes, not just pricing tweaks. Every unprofitable pattern is really pointing at an operational inefficiency that needs fixing.
The reality of running a profitable field service operation
After building and analyzing unit-cost models across the spectrum—HVAC, plumbing, electrical, commercial equipment, facility maintenance—the same pattern shows up everywhere. The businesses making real money aren't necessarily charging the highest prices or running the leanest operations. They're the ones who understand their true costs at a granular level and align their entire operation around profitable work.
This isn't about turning away every marginally profitable job. Some strategic accounts or service areas might run at breakeven to maintain market presence. But you need to know that's what you're doing. Too many field service businesses accidentally subsidize unprofitable customers for years, thinking they're building valuable relationships when they're really just burning cash.
The workbook framework outlined here isn't perfect. It requires maintenance, makes some allocation assumptions, and can't capture every nuance of your operation. But it's infinitely better than the "markup and pray" pricing strategy most field service businesses default to. Start simple, track religiously, and refine quarterly. Within a year, you'll have profitability visibility that puts you ahead of most of your competition.
Most importantly, use the data to make hard decisions. That longtime customer whose work consistently loses money needs a price increase or a goodbye. That new territory you're excited about expanding into—run the unit economics first. That SLA structure your sales team is pushing—model the true cost before saying yes.
Field service profitability isn't about working harder or even necessarily smarter. It's about knowing which work actually makes money and building your operation around capturing more of it. The math isn't complicated once you have the right framework. The hard part is having the discipline to follow what the numbers tell you, even when it means saying no to revenue that doesn't generate profit.
Ready to optimize your field operations?
Join 2,000+ service teams using Romrly to boost productivity, reduce downtime, and enhance customer satisfaction.