
Asset lifecycle management in field service operations tends to hit the same wall around year three or four: equipment starts failing unpredictably, replacement budgets balloon out of nowhere, and managers end up making reactive purchase decisions that ripple through operations for years. The problem isn't just aging equipment—it's that most field service businesses never build a real system for tracking failure patterns across mixed fleets.
What makes this painful is how differently equipment ages. Diagnostic tablets might last 18 months before the software outgrows them. Service vans run strong to 150,000 miles then need transmission work. Specialized testing equipment soldiers on for a decade with proper calibration. And you're trying to balance all these timelines against customer SLAs, technician productivity, and a capital budget that gets scrutinized every quarter.
The companies that handle this well aren't necessarily the ones with the biggest budgets. They're the ones who built decision frameworks that account for failure modes, operational impact, and staged replacement schedules—ones that know which assets to run into the ground and which need proactive replacement. And they've figured out how to pool spares strategically without tying up excessive capital in inventory.
Why traditional replacement strategies fall apart with mixed fleets
Most asset replacement advice assumes uniform equipment—replace everything at 80% of expected lifespan, maintain 15% spare inventory, budget 20% of asset value annually. Fine if you're managing one equipment type. But field service operations juggle completely different asset categories with incompatible failure patterns.
Take a typical HVAC service company. They're running service vans accumulating 35,000 miles a year, diagnostic equipment that gets dropped and banged around daily, tablets needing constant software updates, specialized refrigerant recovery units requiring EPA certification, and ladder racks that basically last forever unless someone backs into something. Each category has distinct failure triggers, replacement lead times, and operational dependencies.
The real complexity is how these assets interact operationally. A van breakdown doesn't just idle one technician—it cascades through dispatch, forces equipment transfers between vehicles, and potentially violates SLAs if priority customers can't be reached. A failed diagnostic tool might only affect certain job types, but if those are your highest-margin commercial contracts, the financial impact can exceed multiple van breakdowns.
Traditional depreciation schedules make this worse. Finance wants everything on five-year straight-line depreciation, so managers end up replacing perfectly functional equipment while running critical assets past their failure points. The accounting looks clean. Operations suffers from both premature replacements and unexpected failures.
Building a failure-mode decision matrix that actually works
The framework that consistently works starts with categorizing assets by their failure patterns, not their accounting classifications. Instead of grouping "vehicles" together, you separate high-mileage service vans from low-mileage supervisor trucks. Instead of lumping all "tools," you distinguish between mechanical tools that fail gradually and electronic diagnostics that fail suddenly.
Eliminate field service chaos with Romrly.
Romrly helps you assign, track, and complete service jobs efficiently and on time.
- Unified job scheduling
- Technician dispatch & tracking
- Customer notifications & updates
No credit card required
| Asset Type | Primary Failure Mode | Warning Signs | Replacement Lead Time | SLA Impact | Spare Pool Strategy |
|---|---|---|---|---|---|
| Service Vans (high mileage) | Transmission/engine at 140k-160k miles | Check engine codes, rough shifting | 4-6 weeks for fleet spec | Critical - affects all jobs | 1 spare per 8 active |
| Diagnostic Tablets | Software incompatibility at 18-24 months | App crashes, slow performance | 1-2 weeks | Moderate - workarounds exist | 1 spare per 12 active |
| Refrigerant Recovery Units | Compressor failure at 6-8 years | Recovery times increase | 3-4 weeks | High for commercial | 1 spare per 6 active |
| Basic Hand Tools | Gradual wear, rarely critical | Visible damage | 1-3 days | Low - techs have backups | Replace on failure |
| Ladder Systems | Damage from accidents | Visual inspection | 1 week | Job-specific impact | No spares needed |
The power comes from linking failure modes to operational consequences. A tablet crash during a residential call might mean switching to paper forms temporarily. That same crash during a commercial preventive maintenance route could violate contract terms requiring digital documentation and photo verification.
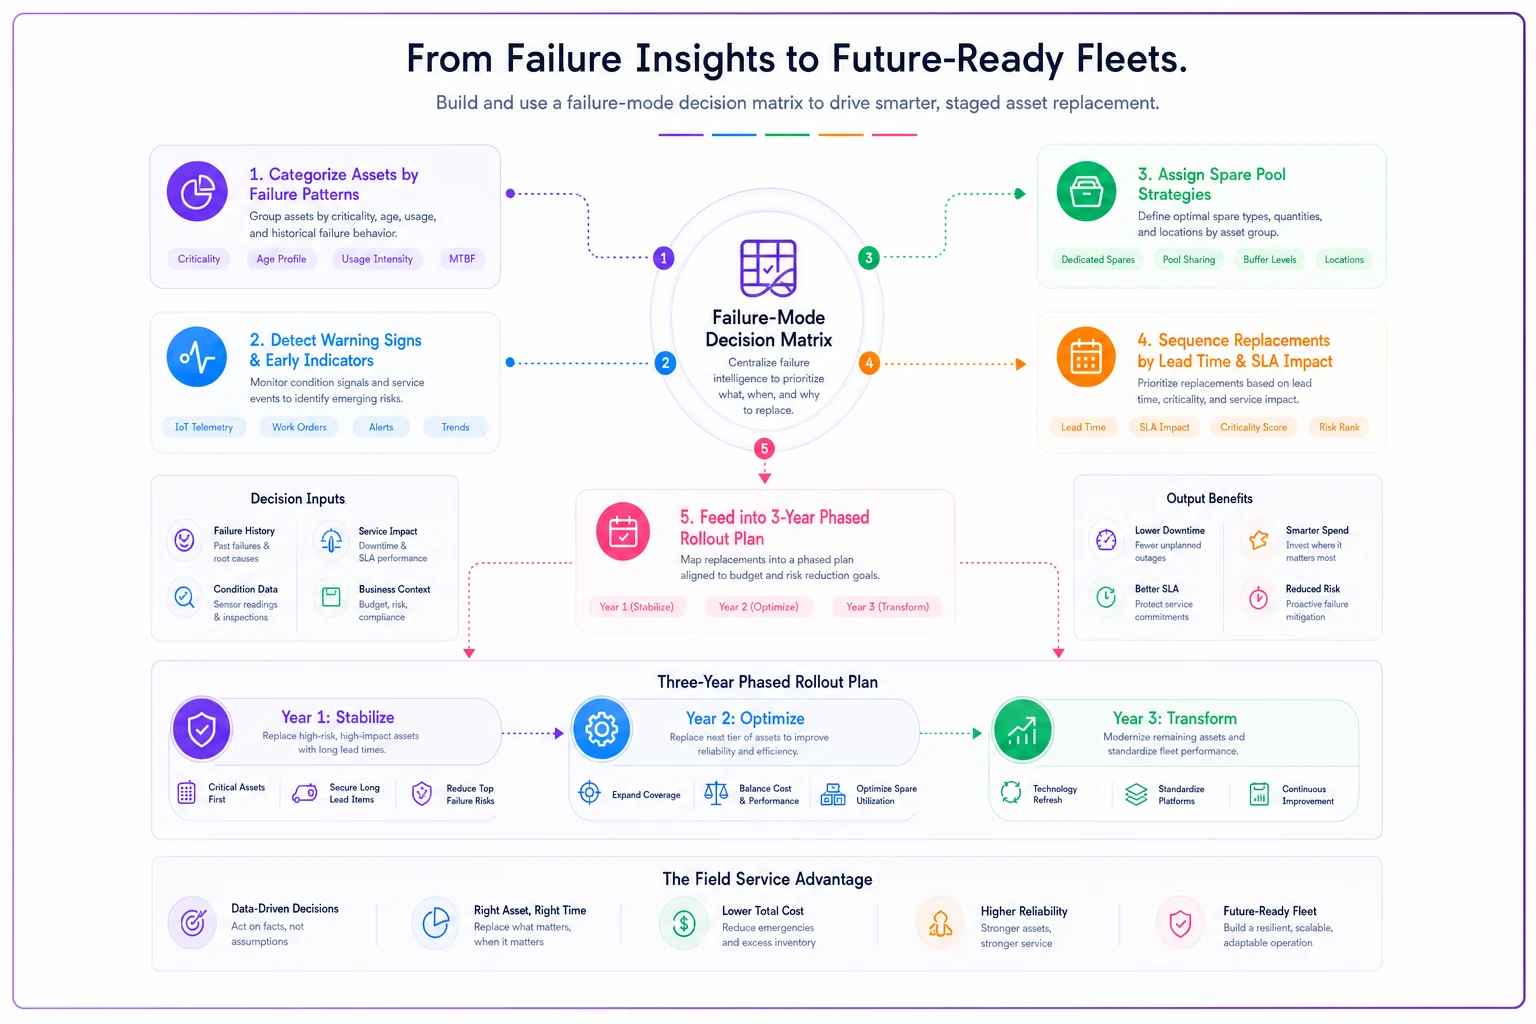
A simple workflow diagram helps teams see how the matrix feeds replacement decisions.
What separates this from generic asset tracking is that failure patterns need to reflect your specific operation. Commercial HVAC companies might find recovery units fail faster due to heavy daily use, while residential-focused operations see longer lifespans but more sudden failures from irregular use. The matrix should adapt to your actual failure data, not manufacturer estimates.
The three-year phased replacement roadmap
Once you understand failure patterns, the next challenge is sequencing replacements to avoid budget spikes and operational disruptions. The companies that handle this smoothly use a rolling three-year plan that staggers replacements based on criticality and interdependencies.
-
Year one focuses on critical assets approaching failure thresholds—typically your highest-mileage vehicles, oldest diagnostic equipment, and any specialized tools with long lead times. The key is starting replacement before failure becomes likely, around 70% of expected lifespan for critical assets. That gives you negotiating leverage with vendors and time to properly spec replacements.
-
Year two addresses moderate-priority assets and begins rotating your spare pool. This is when you replace equipment that's functional but becoming maintenance-intensive. Service vans hitting 100,000 miles get cycled to light-duty roles while newer units take over high-mileage routes. Diagnostic equipment from year one becomes your spare pool for remaining units.
-
Year three handles remaining assets and establishes your steady-state replacement cycle. By this point you've eliminated most surprise failures and can predict budget needs within 10-15%. More importantly, you've built institutional knowledge about actual failure patterns versus manufacturer claims.
The phasing matters because it smooths cash flow and reduces operational risk. Instead of replacing 40% of your fleet in one year because everything aged together, you're replacing roughly 15% annually in a controlled pattern. This also lets you take advantage of vendor incentives, bulk purchasing opportunities, and end-of-model-year deals without being forced by emergency timing.
Smart spares pooling for mixed equipment types
Keeping 10-20% extras of everything wastes capital and warehouse space. Mixed fleets need tiered pooling strategies based on failure impact and replacement difficulty.
Critical spares with universal applications get the deepest pools. If you run 24 service vans across three locations, keeping two spare vans (around 8%) makes sense because any technician can use any van. But keeping two spare refrigerant recovery units when you only have six total (33%) might be excessive if only certified techs can operate them.
Geographic distribution changes the equation. A company with techs spread across a 50-mile service area needs different sparing strategies than one working from a central shop. Remote techs might each carry backup diagnostic tablets, while centralized operations can share a smaller pool.
The real optimization comes from cross-functional spares—assets that can serve multiple roles. A supervisor's low-mileage truck becomes the emergency replacement for van breakdowns. Older-generation diagnostic tools get relegated to backup status but stay calibrated and ready. Previous-version tablets become training units that can substitute in emergencies.
Older-generation diagnostic tools get relegated to backup status but stay calibrated and ready.
This is where AI-powered operational platforms make a real difference. Manual tracking in spreadsheets loses visibility into usage patterns, maintenance histories, and cross-functional dependencies. Modern operations software automatically tracks mileage, usage hours, error codes, and performance degradation across your entire fleet. The system identifies units approaching failure thresholds, suggests replacement timing based on operational calendars, and maintains spare pool assignments to prevent accidental deployment of backup units.
Connecting replacement timing to SLA commitments
The most expensive asset failures aren't necessarily the highest-cost equipment. They're the ones that cause SLA breaches, especially with commercial contracts carrying penalties.
Commercial contracts typically specify response times, first-call resolution rates, and equipment uptime guarantees. A failed diagnostic tool might prevent first-call resolution. A van breakdown could blow response time requirements. Missing specialized equipment might violate the "qualified technician" clauses requiring specific tools and certifications.
Map each asset type to the SLAs it affects. If your premium commercial contracts require 4-hour response, vehicles servicing those accounts need proactive replacement before reliability drops. If certain diagnostic equipment is named in contract terms, those units need higher spare ratios or faster replacement paths.
Seasonal patterns add another layer. HVAC companies can't afford equipment failures during summer peak season when SLA penalties are highest and customer switching is easiest. Planning replacements for shoulder seasons—late fall or early spring—gives you installation time, training windows, and lower operational risk.
SLA-based replacement timing beats pure financial optimization. A company might save $30,000 by stretching vehicle replacements another year, then lose a $200,000 annual contract because repeated breakdowns violated response time commitments. The matrix needs to weight operational risk appropriately, not just minimize capital expenditure.
Creating budget predictability from chaos
The hidden benefit of systematic asset lifecycle management is transforming replacement costs from unexpected emergencies into predictable budget lines. Finance departments often approve higher total budgets when they can plan for them versus dealing with emergency requisitions.
Start by calculating your total fleet replacement value—every vehicle, tool, and piece of equipment at current replacement cost. For most field service operations, this ranges from $40,000 to $80,000 per technician depending on specialization. Then apply your failure-mode timelines to create an amortization schedule based on actual replacement cycles, not accounting depreciation.
This usually reveals that proper replacement requires 15-20% of total fleet value annually, not the 10-12% most companies budget. But spreading this over predictable quarterly allocations makes it manageable. More importantly, it eliminates emergency purchases that consistently cost 20-30% more due to rushed vendor selection and immediate delivery requirements.
The budget framework should include a contingency pool for unexpected failures—typically around 10% above planned replacements. As your data improves and patterns emerge, this contingency shrinks. Companies three years into systematic replacement planning often predict annual spend within 5% accuracy.
Your modular operations playbook needs to include asset replacement procedures as a core module—not just the purchase process, but decommissioning workflows, data transfer procedures, equipment staging, and technician transition training. When replacement becomes systematic rather than reactive, the operational disruption drops dramatically.
When the matrix says hold but operations says replace
The framework sometimes generates counterintuitive recommendations. The matrix might suggest running certain vehicles another year despite increasing maintenance costs. It might recommend replacing relatively new equipment showing unexpected failure rates. These edge cases test whether you trust the system or override based on gut feeling.
If you've tracked failure patterns for less than 18 months, operational experience should probably override matrix recommendations. If the data spans multiple replacement cycles with detailed failure analysis, trust the framework even when it feels wrong.
Common overrides that actually make sense: technology discontinuation, vendor relationship changes, and regulatory updates. When manufacturers announce end-of-support for critical software, you might accelerate tablet replacements regardless of physical condition. If your fleet maintenance vendor loses key mechanics, switching providers might justify replacing older vehicles that require specialized knowledge.
The dangerous overrides come from temporary pain. A string of breakdowns over two weeks triggers demands to "replace everything now" when the underlying failure rate remains acceptable. A budget windfall encourages premature replacement of functioning equipment. These reactive decisions disrupt the replacement cycle for years, creating future budget spikes that feel like déjà vu.
Integration with preventive maintenance and repair decisions
Your replacement matrix can't exist in isolation from maintenance strategies. The repair-versus-replace decision depends on where assets fall in their lifecycle curve and how maintenance costs are trending.
For vehicles, the typical inflection point is when monthly maintenance exceeds roughly 40% of lease payments for equivalent units. But this misses operational complexity. An older van might cost $800 monthly in maintenance versus $600 for a new lease, suggesting replacement—but if that van serves as a backup for routes with irregular demand, the utilization might not justify new equipment.
Electronic equipment follows different patterns. Diagnostic tools and tablets typically work fine until sudden failure, making preventive maintenance less relevant. Here the focus shifts to software compatibility and feature gaps. When equipment can't run current software or lacks features that actually improve technician efficiency, replacement timing accelerates regardless of physical condition.
Your remote diagnostics program feeds valuable data into these decisions. When you start seeing increased error codes, calibration drift, or performance degradation through remote monitoring, you can adjust replacement timing before failures impact operations—which is a meaningfully better position than waiting for complete breakdowns.
The compound effect of systematic replacement
After running this framework through a full replacement cycle—typically three to five years—compound benefits emerge that justify the upfront planning effort. Operations runs smoother with fewer emergency failures. Technicians trust their equipment and report issues earlier, knowing replacement follows logical patterns. Finance appreciates predictable budgets and fewer panicked requisitions.
The real value accumulates through institutional knowledge. After tracking failure modes across multiple cycles, you know which vehicle models actually hold up in your operation. You understand which diagnostic tool manufacturers provide reliable long-term support. You've identified which assets can run to failure versus which need proactive replacement.
That knowledge becomes a competitive advantage. While competitors deal with emergency breakdowns and reactive purchasing, you're negotiating volume deals with proven vendors and standardizing on equipment that matches your operational patterns—rather than chasing the latest technology fads that promise efficiency but create compatibility headaches.
The framework also supports growth planning. When adding technicians or expanding service areas, you know exactly which assets to buy and when they'll need replacement. The mystery disappears from fleet scaling, replaced by predictable patterns and proven decisions.
Making it stick: governance and continuous improvement
The best framework fails without consistent execution and periodic refinement.
Assign a single person—typically the operations manager or fleet coordinator—to own the replacement matrix. They track failure patterns, update replacement schedules, and coordinate with finance on budget planning. This can't be a committee responsibility or a part-time addition to other duties. Asset lifecycle management needs dedicated oversight to stay consistent.
Schedule quarterly reviews to assess prediction accuracy and adjust timelines. If vehicles consistently last longer than predicted, extend replacement cycles. If certain equipment fails earlier than expected, investigate root causes—might be usage patterns, maintenance gaps, or environmental factors specific to your operation.
Build feedback loops with technicians who use equipment daily. They notice performance degradation before it shows in metrics. They know which features actually matter versus what looks good in a vendor demo. Their input improves both replacement specifications and timing decisions.
Modern operational platforms help with this governance by centralizing asset data, automating threshold alerts, and maintaining replacement histories. Instead of manual spreadsheet updates and calendar reminders, the system tracks everything automatically and surfaces decisions when needed—reducing administrative burden while improving consistency.
The companies getting this right treat asset replacement as a strategic capability, not an administrative task. They understand that predictable, optimized replacement cycles reduce total cost while improving operational reliability. They've eliminated the chaos of reactive decisions that disrupts operations and destroys budgets.
Building this systematic approach takes roughly six months to design and another year to fully implement across mixed fleets. But once it's established, it runs largely on autopilot with periodic adjustments based on operational learning. The upfront investment pays back through reduced emergency costs, improved SLA performance, and enough operational predictability that you can actually focus on growing the business instead of fighting fires.
Building this systematic approach takes roughly six months to design and another year to fully implement across mixed fleets. But once it's established, it runs largely on autopilot with periodic adjustments based on operational learning. The upfront investment pays back through reduced emergency costs, improved SLA performance, and enough operational predictability that you can actually focus on growing the business instead of fighting fires.
Ready to optimize your field operations?
Join 2,000+ service teams using Romrly to boost productivity, reduce downtime, and enhance customer satisfaction.