
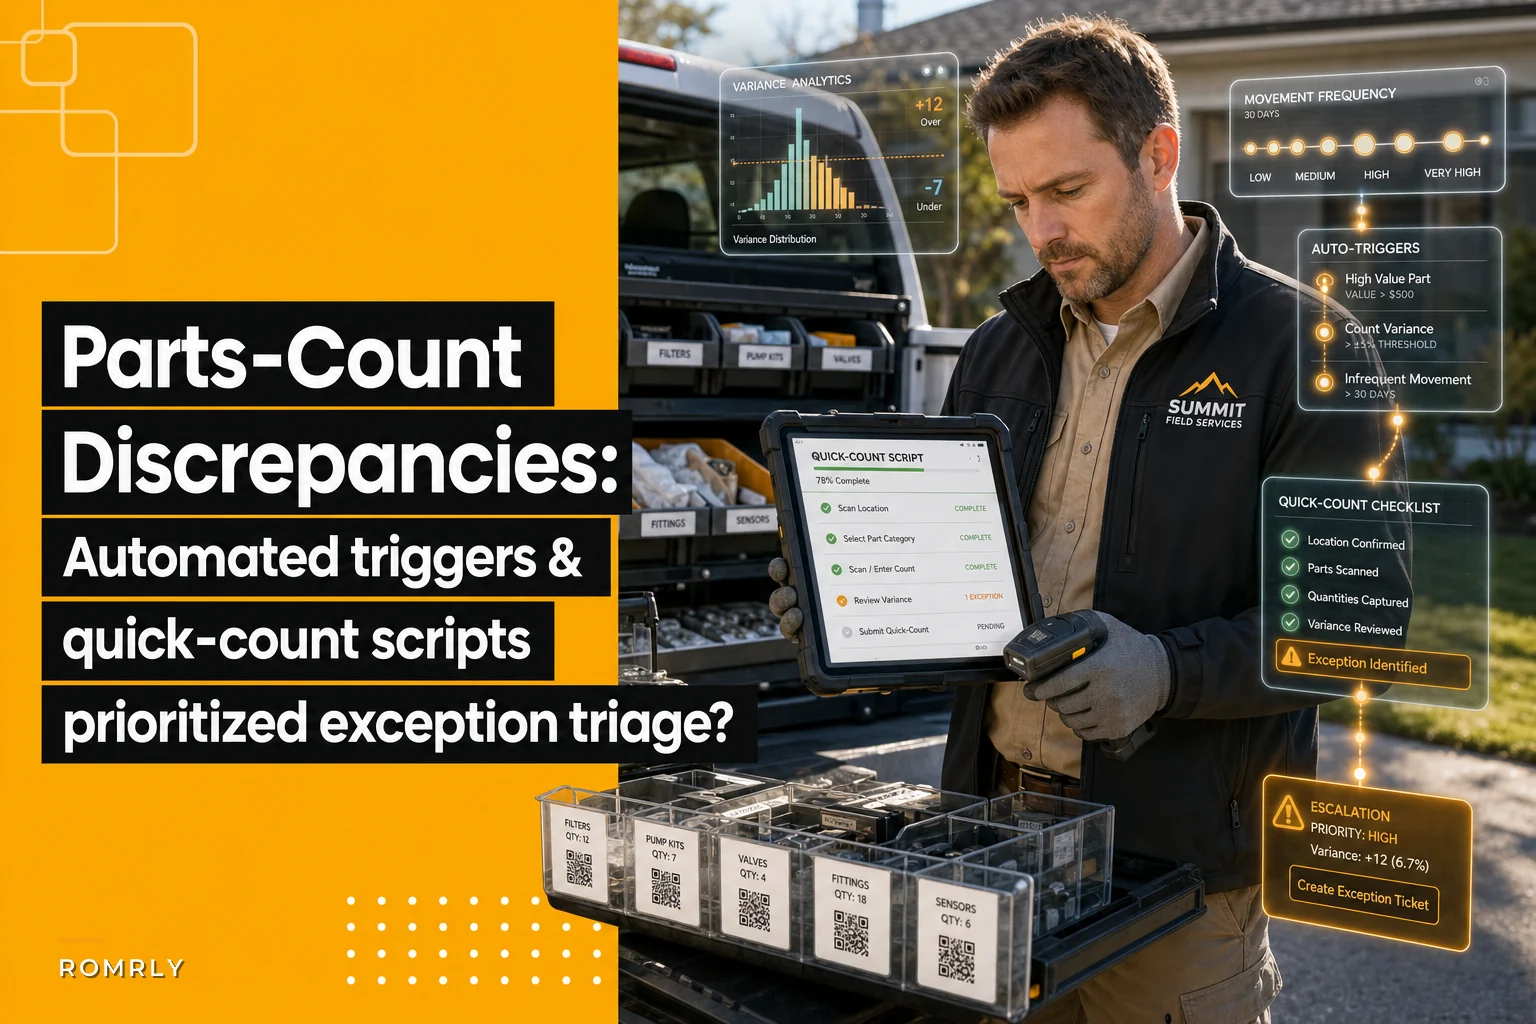

Parts count discrepancy in field service creates this specific, frustrating situation where your warehouse shows 47 units of a common capacitor, your system says 23, the tech's van supposedly has 8, but when a customer needs one at 4pm on a Friday, nobody can find a single unit. Meanwhile, your team spends Monday mornings counting washers and zip ties that haven't moved in three weeks.
Why traditional cycle counting fails in field service
Office supply companies can run predictable cycle counts because their inventory sits still. Field service parts move constantly—warehouse to van at 6am, van to customer site at 9am, maybe back to van if unused, possibly handed off to another tech in a parking lot, eventually returned or written off. Every movement is a potential discrepancy.
A commercial HVAC company I worked with tracked over 2,800 unique parts. Their inventory team spent roughly 30% of their time investigating discrepancies, yet stockouts still killed about 12% of first-time fix rates. The breaking point came when they found $18,000 in specialized compressor parts sitting in a retired tech's garage—parts their system had logged as consumed six months earlier.
Standard inventory software treats all discrepancies the same. A missing $0.30 wire nut triggers the same alert as a $300 control board variance. Your team drowns in low-value investigations while the high-impact stuff slips through.
Building smarter exception triggers
The first step is accepting that perfect accuracy is both impossible and unnecessary. What you need instead are intelligent triggers that flag the discrepancies worth investigating.
Eliminate field service chaos with Romrly.
Romrly helps you assign, track, and complete service jobs efficiently and on time.
- Unified job scheduling
- Technician dispatch & tracking
- Customer notifications & updates
No credit card required
Start with value-based thresholds. A missing box of screws might be a $50 discrepancy—if you stock 20 boxes, that's statistical noise. A single missing VFD drive at $1,200 demands immediate attention. Triggers should factor both absolute value and percentage variance.
| Factor | Weight | Calculation |
|---|---|---|
| Dollar variance | 40% | Absolute difference × unit cost |
| Percentage variance | 25% | (System count - Physical count) / System count |
| Part criticality | 20% | Custom score based on stockout impact |
| Days since last movement | 15% | Higher score for parts that shouldn't have moved |
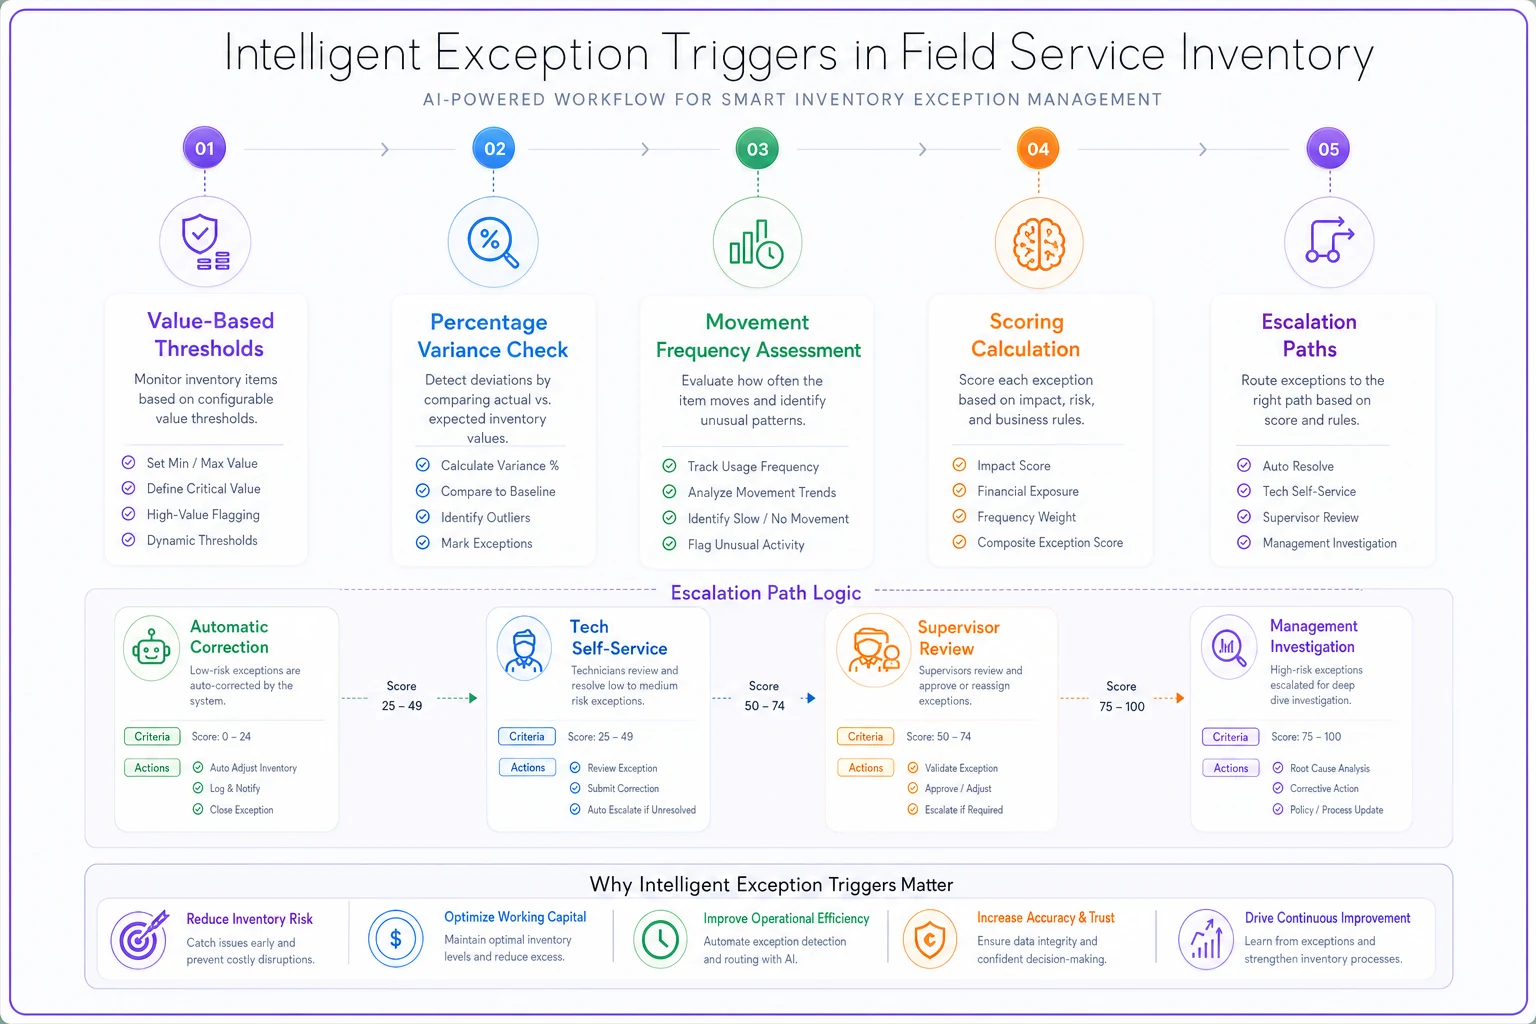
Anything scoring above 75 triggers immediate investigation. Scores between 50–75 go into weekly review. Below 50 gets bundled into monthly reconciliation.
A simple diagram of the trigger workflow helps visualize how scores move from detection to action.
Anything scoring above 75 triggers immediate investigation. Scores between 50–75 go into weekly review. Below 50 gets bundled into monthly reconciliation.
Mobile quick-count scripts that techs will actually use
The biggest source of parts count discrepancy in field service happens in the van. Techs grab parts during jobs, sometimes return extras, occasionally transfer to other techs, and rarely update the system accurately. Asking them to do full counts is unrealistic—they're focused on fixing equipment, not inventory management.
Quick-count scripts work because they're surgical. Instead of "count everything in your van," the system asks targeted questions based on that day's actual work:
"You showed 12 contactors this morning. Job 4847 used 2. Quick count your contactors now—should be 10."
The tech opens one bin, counts, and confirms or corrects. Takes 15 seconds. If the count is off, the system follows up:
"Did you use contactors on another job today? Transfer any to another tech?"
These targeted questions catch discrepancies while memories are fresh. An electrical contractor using this approach brought van inventory variance down from 31% to around 8% in four months. More importantly, their techs stopped treating inventory tasks like bureaucratic punishment.
And cap each session at 3–5 items.
The scripts need smart timing too. Don't interrupt a tech dealing with an emergency call. Queue quick-counts for natural breaks—end of a job, lunch, driving between sites. And cap each session at 3–5 items. You want compliance, not completeness.
Frequency-based triage rules
Not all inventory moves at the same pace, and your auditing shouldn't pretend otherwise. High-velocity parts need different handling than specialty items sitting on a shelf for months.
Build movement tiers from historical data:
Daily movers (200+ transactions/month): Constant handling creates natural variance. A 10% swing might be completely normal. Only investigate when patterns emerge—like consistent shortages every Thursday, which often points to a specific tech or route.
Weekly movers (20–200 transactions/month): Tighter controls. A 5% variance triggers review. These parts are common enough to affect service but infrequent enough that discrepancies usually signal a process problem.
Monthly movers (5–20 transactions/month): Any variance over 2 units or 3% needs investigation. Higher values and longer lead times make these more critical.
Rare movers (<5 transactions/month): Ironically, these need the most attention. When a specialized part that hasn't moved in 60 days suddenly shows a discrepancy, something's actually wrong—miscoding, theft, or a system error.
A pool service company implemented this tiered approach and found their real problem wasn't the chlorine tablets everyone counted weekly (daily mover, acceptable variance) but specialty pump parts disappearing between rare uses.
Escalation thresholds that prevent audit paralysis
Too many alerts and people ignore them. Too few and problems pile up quietly.
Here's an escalation framework that balances coverage with sanity:
-
Level 1 – Automated correction (no human involvement) - Variance under $25 or 5% on daily movers - System adjusts counts automatically - Logged for pattern analysis, no alerts
-
Level 2 – Tech self-service - Variance $25–100 on parts they touched - Mobile notification to the involved tech - 24-hour window to explain or correct - Auto-escalates if no response
-
Level 3 – Supervisor review - Variance $100–500 or critical parts - Flagged for next-day investigation - Supervisor approves adjustment or digs deeper - Must document resolution
-
Level 4 – Management investigation - Variance over $500 - Pattern of discrepancies from the same source - Missing serialized equipment - Immediate lock on affected inventory - Full audit trail required
Level 1 handles around 70% of discrepancies without anyone touching them. Level 2 catches another 20% through quick tech feedback. Only about 10% require supervisor time, and fewer than 2% need management.
Reducing audit load through intelligent sampling
Full physical counts are operationally destructive. They disrupt service, frustrate staff, and rarely fix underlying problems. Smart sampling gives you most of the benefit at a fraction of the cost.
Instead of counting everything quarterly, use risk-based sampling:
High-risk items—serialized, high-value, theft-prone, or with recent discrepancies—get monthly counts. This might be 5% of SKUs but 40% of inventory value.
Medium-risk items rotate through 25% monthly samples, covering the full list over a quarter. Focus on parts with irregular movement or multiple storage locations.
Low-risk items get annual counts unless an exception triggers something. Nobody needs to count wire nuts every month.
The operational trick: piggyback counts onto things already happening. When a tech grabs parts for a big job, have them count the adjacent bin. When receiving new inventory, count existing stock before putting away the new shipment. When organizing remote parts lockers, validate counts during access.
Automation that handles the repetitive investigation work
Most discrepancy investigations follow predictable patterns. Check recent jobs, review transfer records, look for receiving errors, verify returns processing. This detective work eats hours but rarely requires human judgment until the very end.
AI-powered automation handles the grunt work well. When a discrepancy triggers, the system automatically:
-
Pulls job records for that part over the past 7 days
-
Identifies all techs who accessed it
-
Checks receiving documents and returns
-
Compares usage patterns to historical averages
-
Looks for data entry tells (quantities ending in 0 or 5 are a classic sign of guessing)
Then it surfaces a summary: "Likely cause: Job 8892 shows 2 units used but tech notes indicate 3 installed. Tech Johnson, customer Smith Dental, Tuesday 2:15pm."
Your team jumps straight to resolution instead of spending time on investigation. An HVAC company using this cut investigation time from 45 minutes per discrepancy to under 8.
The automation also catches patterns humans miss—discrepancies clustering around specific techs, certain days, particular part types. One plumbing company traced all their Monday morning discrepancies back to weekend emergency calls where on-call techs pulled parts from the warehouse without checking them out.
Real scenario: Commercial kitchen equipment service
A commercial kitchen service company with 24 techs was drowning in inventory chaos. Around 1,800 SKUs across a main warehouse and 8 satellite locations. Monthly physical counts showed 22% variance rates, and parts count discrepancy issues were eating into margins.
Their old process: monthly full counts requiring 3 people over 2 full days, 40–50 daily alerts nobody had time to investigate, and techs who'd stopped following inventory procedures because the system cried wolf constantly.
Weeks 1–2: Set up value-based triggers and movement tiers. Daily alerts dropped from 40+ to around 12 meaningful ones immediately.
Weeks 3–4: Rolled out mobile quick-counts. Started with 5 high-value parts per tech per day. Compliance hit 80% right away because it took 2 minutes, not 20.
Weeks 5–8: Refined escalation thresholds based on actual patterns. Discovered most discrepancies happened Thursday and Friday when techs rushed end-of-week jobs.
Month 3: Activated automated investigation. System pre-investigates and presents likely causes for review.
-
Variance rate dropped from 22% to 7%
-
Investigation time reduced by 75%
-
Found $26,000 in misplaced inventory in the first quarter
-
Stockouts on critical parts went from weekly to rare
-
Monthly count time dropped from 48 person-hours to 12
The key wasn't counting more. It was counting smarter.
Implementation priorities for your exception system
Build this in phases. Don't try to do everything at once.
Month 1: Implement value-based exception triggers. Focusing alerts on expensive parts alone cuts noise by roughly 60%. You can start in Excel if needed—no fancy software required yet.
Month 2: Roll out mobile quick-counts for your top 20 problem parts. Keep the scripts simple—one question, quick answer, move on.
Month 3: Add movement-based tiers to your triggers. Even rough categories help. The payoff is stopping investigations on normal variance for high-velocity parts.
Month 4: Build your escalation matrix. Define clear ownership at each level. Make sure techs know what they can resolve themselves versus what triggers supervisor involvement.
Month 5: Shift to intelligent sampling instead of full counts. Monthly counts on your top 10% most valuable items, quarterly sampling on the middle 30%, and stop counting the bottom 60% unless something triggers it.
Month 6: Layer in automation for investigation and pattern detection. By now you have clean enough data for the system to separate real patterns from noise.
Common patterns that indicate systematic problems
Individual discrepancies are symptoms. Patterns are the actual disease.
Time-based clusters: Spikes on specific days usually mean process gaps—Friday afternoon shortcuts, Monday morning rushes, or month-end adjustments gone sideways.
Tech-specific variance: When certain techs consistently show discrepancies, it's rarely theft. Usually it's training gaps, different interpretations of procedure, or route-specific challenges nobody's accounted for.
Part-type patterns: Similar parts showing similar discrepancies often points to coding issues. If all 3/4" fittings are off by roughly the same percentage, someone probably confused the unit of measure somewhere upstream.
Location correlation: Discrepancies clustering around specific storage areas might mean access control issues, poor labeling, or environmental factors you haven't considered.
Customer-type variance: Emergency calls, after-hours service, or certain industries create different consumption patterns than your standard processes assume.
When you spot patterns, fix systems—not symptoms. One apartment maintenance company noticed discrepancies always spiked during move-out season. Techs were pulling extra parts "just in case" for unit turnovers, then dumping unused extras in random vans instead of returning them. They created dedicated turnover kits. The problem went away.
Stop chasing perfection, start managing by exception
Perfect inventory accuracy is a fantasy in field service. Your parts are scattered across dozens of locations, handled by people focused on fixing things rather than counting them. The goal isn't eliminating every discrepancy—it's catching the ones that matter before they hurt operations.
Smart exception handling means accepting small variances as normal while ensuring real problems surface immediately. Your techs spend seconds confirming critical counts instead of hours on comprehensive audits. You investigate 10 meaningful discrepancies instead of drowning in 100 false alarms.
The path from inventory chaos to controlled operations isn't through more counting—it's through smarter detection, focused investigation, and systematic resolution of root causes. When you stop trying to perfect every count and start managing by exception, the real problems that have been hiding in the noise start to surface.
Your techs will stop dreading inventory tasks. Your dispatchers will trust the availability data. Your customers will see better first-time fix rates. And your write-offs will drop from "concerning" to something you can actually live with. The parts are out there. You just need a better way to track the ones that actually matter.
Ready to optimize your field operations?
Join 2,000+ service teams using Romrly to boost productivity, reduce downtime, and enhance customer satisfaction.