


Most field service shops don't have a data warehouse. They have a scheduling tool, a parts system, maybe an accounting package, and a pile of exported CSVs sitting in someone's Downloads folder. The owner knows the business is leaking money somewhere—repeat visits, parts write-offs, missed SLAs—but nobody can point to where without spending three days reconciling spreadsheets.
The usual advice is "build a modern data stack." That's useless here. You don't have an ETL engineer. You're not going to stand up Airflow for a 14-truck operation. What you actually need is a small set of repeatable queries, a handful of canonical tables you trust, and a rhythm for turning what you find into tickets that someone actually fixes.
This is a practical recipe for exactly that—canonical datasets you can define in an afternoon, SQL snippets you can paste and adjust, RCA ticket templates for the failures that keep showing up, a scoring model to decide what to fix first, and a quarterly cadence so insights don't die in a dashboard nobody opens.
Start with five canonical datasets, not fifty
The single biggest reason analytics fails at small field service companies isn't tooling. It's that every query pulls from a slightly different definition of "job." One report counts a job when it's scheduled, another when it's invoiced, another when the tech clocks out. The numbers never match, people stop trusting them, and the whole effort quietly dies.
Before you write a single query, lock down five canonical tables. These become your source of truth. Everything else derives from them.
| Dataset | Grain (one row = ) | Key fields you actually need |
|---|---|---|
jobs | one work order | jobid, customerid, assetid, createdat, scheduledat, completedat, status, jobtype, assignedtech_id, revenue |
visits | one physical trip to site | visitid, jobid, techid, arrivedat, departed_at, outcome (fixed / partial / no-access / return-needed) |
parts_usage | one part consumed on a job | jobid, sku, qty, source (truck / warehouse / emergency-buy), unitcost |
assets | one serviceable unit | assetid, customerid, model, installdate, warrantyend |
sla_events | one SLA clock event | jobid, slatype, promisedby, met (bool), creditamount |
Notice what's not here. No sprawling customer CRM tables, no technician HR records, no vendor catalogs. Those can join in later. These five answer roughly 80% of the operational questions that actually cost you money.
One pattern worth calling out: the visits table is the one most teams skip, and it's the most important. If your system only tracks jobs, you literally cannot measure first-time-fix, because a "job" that took three trips still shows as one completed job. Separating visits from jobs is what makes the hard questions answerable. If you want the deeper version of how these objects relate and sync, the canonical object model and conflict-resolution blueprint goes much further than we need to here.
Track visits separately from jobs—it's essential to measure first-time-fix.
You don't need a warehouse for this. A read-only replica of your operational database works. So does a weekly dump of these five tables into DuckDB or even SQLite on a laptop. The point is consistent definitions, not fancy infrastructure.
The SQL snippets that answer the expensive questions
Here are the queries worth having on hand. They're written in plain ANSI-ish SQL—adjust date functions for your database. None of these require joins across more than two or three tables, on purpose.
Eliminate field service chaos with Romrly.
Romrly helps you assign, track, and complete service jobs efficiently and on time.
- Unified job scheduling
- Technician dispatch & tracking
- Customer notifications & updates
No credit card required
First-time-fix rate, by job type
``sql
SELECT
j.jobtype,
COUNT(DISTINCT j.jobid) AS totaljobs,
COUNT(DISTINCT CASE WHEN v.visitcount = 1 THEN j.jobid END) AS onevisitjobs,
ROUND(
100.0 COUNT(DISTINCT CASE WHEN v.visitcount = 1 THEN j.jobid END)
/ COUNT(DISTINCT j.jobid), 1
) AS firsttimefixpct
FROM jobs j
JOIN (
SELECT jobid, COUNT() AS visitcount
FROM visits
GROUP BY jobid
) v ON v.jobid = j.jobid
WHERE j.completedat >= DATE '2025-01-01'
GROUP BY j.jobtype
ORDER BY firsttimefix_pct ASC;
``
Sort ascending so the worst job types float to the top. That's your fix list.
Return-trip reasons (the "why" behind low FTF)
``sql
SELECT
v.outcome,
COUNT() AS visits,
ROUND(100.0 COUNT() / SUM(COUNT()) OVER (), 1) AS pctofreturns
FROM visits v
WHERE v.outcome IN ('return-needed', 'partial')
AND v.arrived_at >= DATE '2025-01-01'
GROUP BY v.outcome
ORDER BY visits DESC;
``
If you capture a return_reason free-text or coded field, group on that instead. In real operations, the top two reasons are almost always "wrong or missing part" and "needs a second tech or more time than scheduled." Both are fixable, and both show up clearly once you can actually query them.
Emergency parts buys — the margin killer nobody watches
``sql
SELECT
DATETRUNC('month', p.purchasedat) AS month,
COUNT() AS emergencylines,
SUM(p.qty p.unitcost) AS emergencyspend
FROM partsusage p
WHERE p.source = 'emergency-buy'
GROUP BY DATETRUNC('month', p.purchasedat)
ORDER BY month;
``
Emergency buys—running to a supply house mid-job because the truck didn't have the part—usually cost 20–40% more per unit and burn a chunk of billable time. Trending this monthly tells you whether your truck stock rules are drifting.
SLA credits leaking out the door
``sql
SELECT
s.slatype,
COUNT(*) AS breaches,
SUM(s.creditamount) AS creditsowed
FROM slaevents s
WHERE s.met = FALSE
AND s.promisedby >= DATE '2025-01-01'
GROUP BY s.slatype
ORDER BY credits_owed DESC;
``
Chronic assets (the repeat offenders)
``sql
SELECT
a.assetid,
a.model,
a.customerid,
COUNT(DISTINCT j.jobid) AS jobslast12mo
FROM assets a
JOIN jobs j ON j.assetid = a.assetid
WHERE j.createdat >= CURRENTDATE - INTERVAL '12 months'
GROUP BY a.assetid, a.model, a.customerid
HAVING COUNT(DISTINCT j.jobid) >= 3
ORDER BY jobslast12mo DESC;
``
Three or more service calls on one asset in a year is a signal, not noise. This query is the raw feed for a proper chronic-asset hot-list and RCA escalation policy—querying them is step one, but forcing the engineering handoff is where the real savings actually live.
A quick note on data quality: all of these queries are only as good as your completed_at and outcome fields. If techs close jobs from the truck without recording the real outcome, your FTF number is fiction. Fix capture discipline before you trust the dashboard.
RCA ticket templates for the failures that keep recurring
Finding a problem in SQL is the easy half. The hard half is making sure the finding becomes a change. A root-cause ticket that just says "FTF is low on HVAC calls" goes nowhere. These templates force the specifics.
The structure stays the same across failure modes—what the data shows, suspected cause, evidence, owner, fix, verification query—but the content differs. Here are templates for the four modes that show up most consistently.
Template A — Repeat-visit / low first-time-fix
``
TITLE: Low FTF on [jobtype] — [XX]% vs [target]%
DATA SIGNAL: [jobtype] FTF at 61% over last 90 days (query: ftfbytype)
SAMPLE: 12 jobs required 2+ visits; pulled visitids attached
SUSPECTED CAUSE: [ ] missing part on truck  [ ] diagnosis error
                 [ ] under-scheduled time  [ ] skill gap
EVIDENCE: 8 of 12 returns coded 'wrong or missing part'
OWNER: [parts lead / dispatch / training]
FIX: Add SKUs 4471, 4480 to standard HVAC truck kit
VERIFY IN 30 DAYS: rerun ftfbytype WHERE jobtype='HVAC'
CLOSE CRITERIA: FTF ≥ 78% sustained 2 consecutive months
``
Template B — Emergency parts spend spike
``
TITLE: Emergency buys up [X]% MoM
DATA SIGNAL: emergencyspend $4,900 in month vs ~$3,100 trailing avg
SUSPECTED CAUSE: [ ] ROP not triggering  [ ] seasonal demand shift
                 [ ] one tech / one depot driving it
EVIDENCE: group emergency lines by techid and sku to isolate
OWNER: inventory / purchasing
FIX: adjust reorder points on top 3 offending SKUs
VERIFY IN 60 DAYS: emergency_spend back under $3,400
``
Template C — SLA breach cluster
``
TITLE: SLA credits concentrated in [territory / slatype]
DATA SIGNAL: $2,300 credits owed, 70% from 'same-day' SLA
SUSPECTED CAUSE: [ ] territory understaffed  [ ] dispatch sequencing
                 [ ] promise times unrealistic for drive distance
EVIDENCE: join slaevents to jobs; check avg promised-vs-arrived gap
OWNER: dispatch manager
FIX: cap same-day promises in [territory] to 6/day
VERIFY NEXT QUARTER: credits_owed for same-day < $800
``
Template D — Chronic asset
``
TITLE: Asset [assetid] — [N] calls in 12 months
DATA SIGNAL: 5 service calls, $X labor + parts consumed
SUSPECTED CAUSE: [ ] end-of-life unit  [ ] install defect
                 [ ] misapplication for the site  [ ] warranty claim missed
EVIDENCE: job history + partsusage attached
OWNER: service manager → engineering review
DECISION: repair-vs-replace recommendation required
VERIFY: no new call for 6 months OR replacement completed
``
The reason these work is the verify query line. It ties the ticket back to the exact SQL snippet that will prove whether the fix actually landed. Most RCA processes fail because nobody checks whether the fix worked—bake the check into the ticket and it stops being optional.
Prioritization: a simple score so you're not fixing the loudest problem
Once you run these queries, you'll find more problems than you can staff. The trap is working on whatever the owner complained about most recently rather than what actually costs the most. A lightweight scoring model cuts through that.
Score each candidate fix on three axes, 1–5:
-
Cost impact — how much money the problem leaks per quarter
-
Effort — how hard the fix is (5 = trivial, 1 = major project)
-
Confidence — how sure you are the data is telling the truth
Then: Priority = (Cost impact × Confidence) × Effort weight.
Keep effort as a multiplier, not a subtraction, so cheap-and-easy wins rise fast.
A worked example from a mid-sized HVAC and refrigeration shop:
| Problem | Cost impact | Effort | Confidence | Score |
|---|---|---|---|---|
| Emergency buys on 3 SKUs | 4 | 5 (easy) | 5 | 100 |
| Low FTF on commercial HVAC | 5 | 2 | 4 | 40 |
| SLA credits in north territory | 3 | 3 | 3 | 27 |
| Chronic walk-in cooler at Site 12 | 2 | 4 | 5 | 40 |
The emergency-buy fix wins—not because it's the biggest leak, but because it's cheap, you're confident in the data, and it pays back almost immediately. The low-FTF problem is a bigger dollar number but a harder, slower project, so it gets scheduled deliberately rather than rushed.
This is the step most teams skip, and it's why their analytics effort stalls. They surface ten findings, try to attack the scariest one, hit organizational resistance, and quit. Start with the high-score, low-effort wins to build momentum and trust in the numbers.
The quarterly insights → action cadence
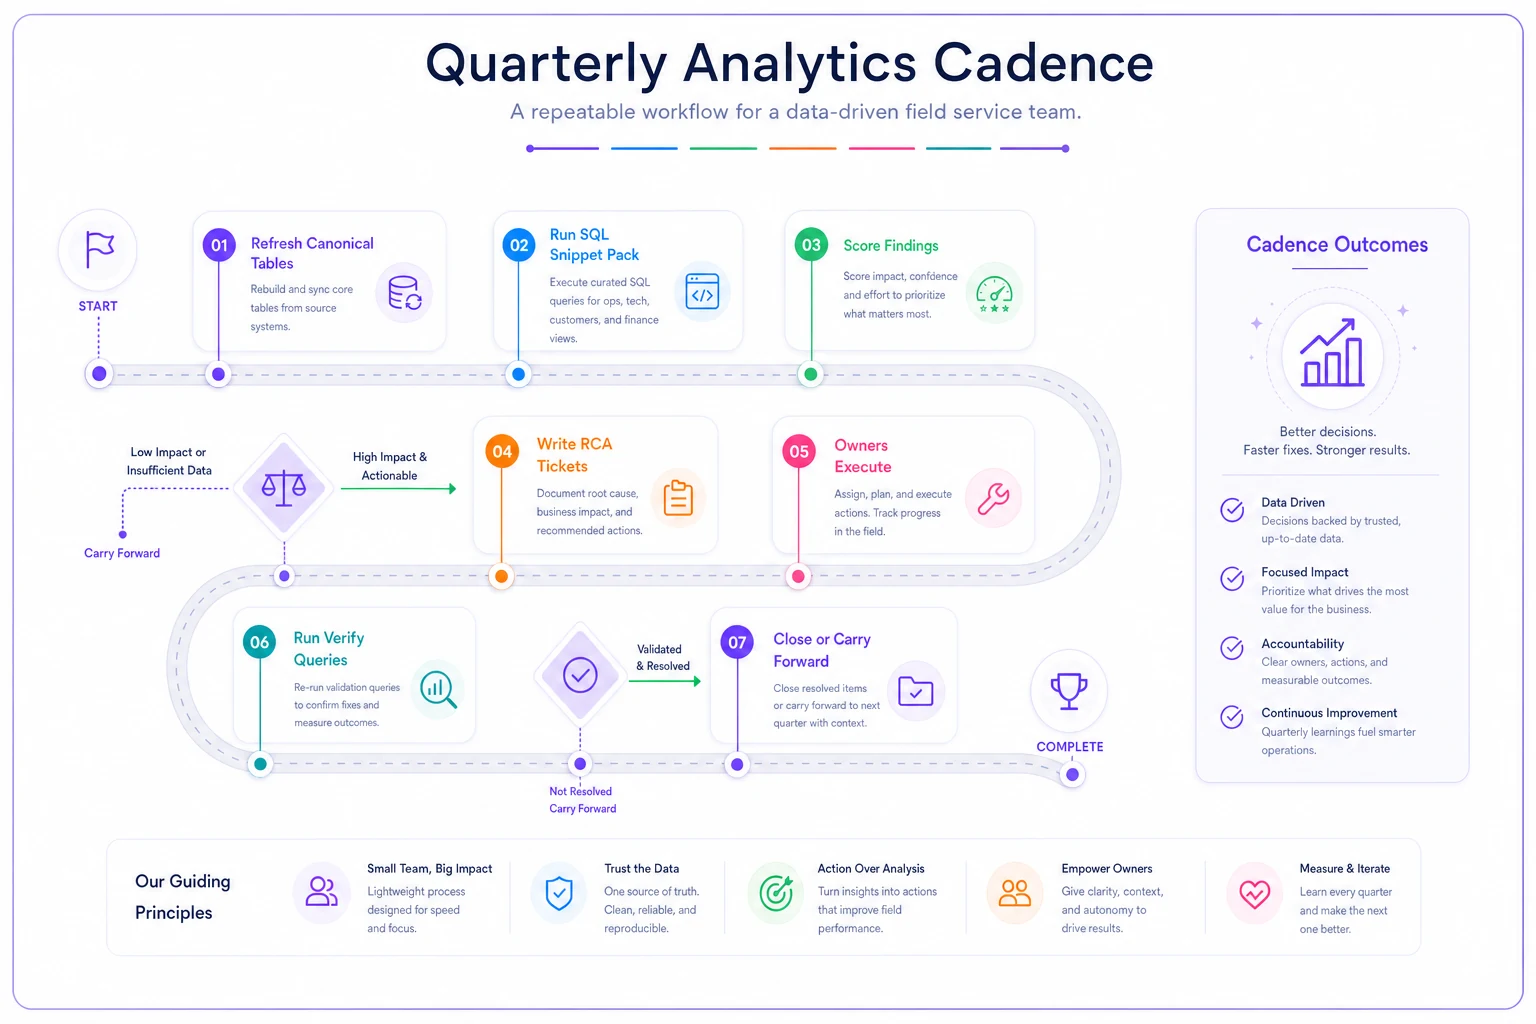
Analytics that runs once never changes anything. Analytics that runs weekly becomes noise and gets ignored. For a small field team, quarterly is the sweet spot—long enough to see a trend, short enough to still matter.
-
Week 1 — Refresh the five canonical tables. Dump, load, sanity-check row counts against last quarter. If
visitssuddenly dropped 30%, that's a capture problem, not a business win. -
Week 1 — Run the snippet pack. FTF, return reasons, emergency buys, SLA credits, chronic assets. Save results with the date.
-
Week 2 — Score the findings. Use the model above. Pick the top three. Not five, not ten. Three.
-
Week 2 — Write RCA tickets. One per finding, using the templates. Assign real owners with real dates.
-
Weeks 3–11 — Owners execute. Quiet period. Nobody's pulling new reports.
-
Week 12 — Run the verify queries. Did FTF move? Did emergency spend drop? Close what's proven, carry forward what isn't, and note which fixes didn't work—that's its own insight.
The rhythm matters more than any single query. A shop that reliably closes three well-chosen tickets a quarter will outperform one that generates beautiful dashboards and acts on none of them.
A realistic before/after
A refrigeration service company running about 240 jobs a month had no idea where margin was going. Three quarters into this cadence:
-
Emergency parts spend dropped from roughly $4k–$5k a month to under $3k, mostly by fixing reorder points on six SKUs the query flagged.
-
First-time-fix on commercial calls climbed from the low 60s to around 76% after they revised two truck kits and added a diagnostic checklist.
-
SLA credits in one struggling territory fell by more than half once they capped same-day promises to match actual drive times.
Nothing here required a data engineer. It required consistent tables, a dozen queries, tickets that got verified, and the discipline to only chase three things at a time.
A simple visual of the quarterly cadence helps keep everyone aligned.
The rhythm matters more than any single query. A shop that reliably closes three well-chosen tickets a quarter will outperform one that generates beautiful dashboards and acts on none of them.
When this makes sense — and when it doesn't
This works well when you've got at least a few months of reasonably clean job and visit data, an operational database you can read from, and someone willing to own the quarterly rhythm—even part-time. Teams running 50+ jobs a month almost always have enough signal to act on.
This is a bad idea when your capture discipline is broken. If techs don't record real outcomes, if jobs close without parts logged, if "completed" means "we think it's done"—no query will save you. Fix the capture first. A clean spreadsheet beats a dirty warehouse every time.
Who should not bother yet: brand-new operations with under a couple hundred total jobs. You don't have enough history for trends to mean anything. Run the business, capture clean data, and revisit in six months.
Where tooling quietly helps
Most of this you can do with a database connection and a notebook. The part that breaks down manually is consistency—remembering to refresh the tables, rerun the pack, and actually close the loop on verify queries.
That's where operational software with built-in reporting earns its place. When the canonical tables are maintained automatically and the verify query can be scheduled to re-flag whether a fix held, the cadence stops depending on one person remembering to do it. AI-assisted operational platforms handle exactly this kind of background consistency work—not by replacing the analysis, but by making sure the rhythm doesn't slip when things get busy.
The queries and templates here work regardless of what system you run them in. The goal is the discipline, not the dashboard. Start small—define the five tables this week, run two or three of the snippets against last quarter's data, and you'll almost certainly find one emergency-buy or repeat-visit pattern worth a ticket before you've finished reading your own results. Build from there.
Ready to optimize your field operations?
Join 2,000+ service teams using Romrly to boost productivity, reduce downtime, and enhance customer satisfaction.