
Most field service ops don't fail loudly. The dispatch board still lights up, technicians still close jobs, and the SLA dashboard still shows green. Then finance flags that three months of "on-time" jobs actually missed their windows, an IoT feed silently stopped sending arrival pings two weeks ago, and half your automations have been triggering off stale timestamps. Nothing crashed. The data just drifted, and nobody was watching the data itself.
That gap—between "our systems are up" and "our data is trustworthy"—is what a field data observability program closes. This isn't about adding more dashboards. It's about treating your field-event streams (arrival pings, form submissions, parts scans, status changes, GPS breadcrumbs) as a production system that can degrade in ways your job-level KPIs will never surface until it's too late.
Below is how the whole thing works, where it breaks as you scale, and what actually keeps automations and SLA math honest.
The core problem: your metrics measure jobs, not the data behind them
You build a KPI framework, wire up SLA reporting, maybe even set up predictive maintenance triggers. All of it assumes the underlying event data is complete, timely, and correct. It usually isn't—and the failure modes are invisible at the job level.
A technician's phone loses connection at a basement job site. The arrival timestamp gets stamped when the phone reconnects two hours later, back in the truck. To your SLA report, that job looks like a two-hour-late arrival. To reality, the tech was on time. Multiply that across a fleet and you're either eating SLA credits you don't owe or—worse—reporting compliance you can't actually defend in a dispute.
The reverse happens too. A status automation auto-closes jobs after 24 hours of inactivity. An integration hiccup stops pushing "work started" events. Jobs auto-close as complete that were never touched. Everything reads green while your first-time-fix rate is quietly a fiction.
These problems don't show up in job metrics—they show up in data metrics that nobody defined. That's the whole point of observability: you monitor the health of the data stream separately from the outcomes it's supposed to describe.
Data SLIs: the health signals nobody defines until something breaks
Service-level indicators for field data are different from SLIs for uptime. You're not measuring whether the server responds. You're measuring whether the events are arriving, on time, complete, and internally consistent.
Eliminate field service chaos with Romrly.
Romrly helps you assign, track, and complete service jobs efficiently and on time.
- Unified job scheduling
- Technician dispatch & tracking
- Customer notifications & updates
No credit card required
The four data SLIs that catch the most damage:
Freshness. How old is the newest event in a given stream? If your GPS breadcrumb stream's newest event is 40 minutes old during business hours, something upstream broke. Freshness is your smoke detector—it catches dead feeds before they poison a full day of routing decisions.
Completeness. What percentage of expected events actually arrived? If you dispatched 120 jobs today and only 104 have "arrival" events by end of day, your completeness is 87% and your SLA report is missing 16 jobs' worth of truth. Completeness ratios expose silent drops that freshness misses—the stream is flowing, just leaking.
Timeliness / lag. The gap between when an event happened in the field and when it landed in your system. This is the offline-sync killer. High lag means your automations are firing on old reality. A reserve-capacity rule that reroutes based on 90-minute-old positions is worse than no rule at all.
Consistency. Do related events agree? "Work completed" should never have a timestamp before "work started." A parts-scan event should reference a job that exists. Consistency SLIs catch the corruption that comes from conflict resolution gone wrong—which is exactly why your underlying canonical object model and conflict-resolution blueprint matters so much here. Observability without a clean data model just measures chaos faster.
A useful pattern: define each SLI per stream, with a target and a "you must investigate" floor. Don't try to boil the ocean. Start with the three or four streams your SLA math and your most expensive automations actually depend on.
Reconciliation rituals: the part everyone skips
Monitoring tells you a stream looks healthy. Reconciliation proves it is. These are two different jobs, and confusing them is where trust programs collapse.
Reconciliation is the scheduled comparison of your field data against an independent source of truth. The classic example: your dispatch system says 118 jobs were completed yesterday. Your billing system invoiced 111. Your technician timesheets show activity on 121. Which is right? Without a ritual that forces this comparison on a cadence, the discrepancy just sits there until month-end close turns it into a fire.
-
Daily (automated, low-touch) job counts across dispatch, mobile, and billing must match within a tolerance. Anything outside tolerance drops into a morning exception queue.
-
Weekly (human review) SLA-relevant timestamps get spot-checked against GPS or IoT arrival data for a sample of jobs, especially any that were borderline on-time.
-
Monthly (finance-grade) full reconciliation of billable events against completed events, tied to the same evidence you'd need in an SLA dispute.
That monthly one connects directly to protecting revenue. If your event data doesn't reconcile, you can't defend credits, and you can't recover ones you're owed. This is the operational backbone behind a real SLA data governance and dispute SOP—reconciliation is what makes the audit trail actually hold up.
A simple reconciliation template
| Field | What it captures |
|---|---|
| Reconciliation date | When the check ran |
| Streams compared | e.g., dispatch vs. billing vs. mobile |
| Expected count | Source-of-truth number |
| Actual count | What the stream reported |
| Variance | Absolute and % |
| Within tolerance? | Y/N based on preset threshold |
| Exceptions logged | Job IDs flagged for triage |
| Owner | Who investigates |
| Resolution + root cause | Closed-loop notes |
The magic isn't the table—it's that someone owns each row and the root-cause column never gets left blank. A reconciliation ritual where root cause is optional degrades into a number-copying chore within a month.
Here's a simple visual to show how automated daily checks feed an exception queue, weekly human reviews sample flagged jobs, and monthly finance reconciliations close the loop with owners and root-cause notes.
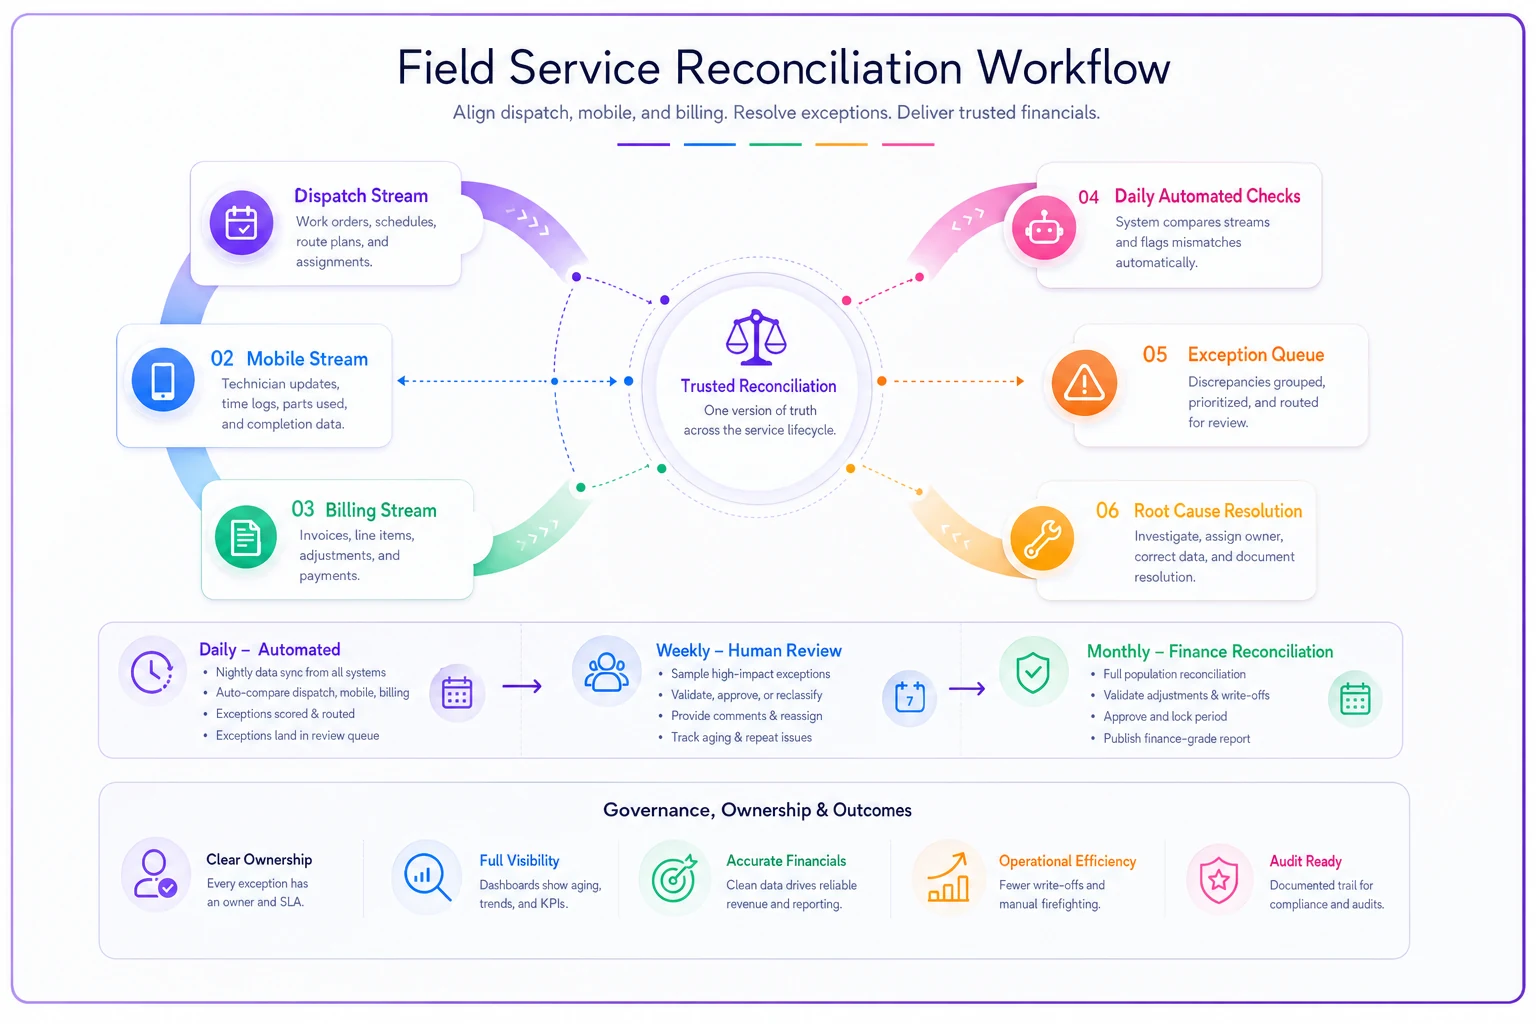
Keep the workflow simple: automated daily gates that escalate into human review and a finance-grade monthly close are what make reconciliation actionable.
Alert thresholds: the difference between a signal and noise
The fastest way to kill an observability program is to alert on everything. Alert fatigue destroys IoT programs constantly, and data-stream alerts fail the same way. The fix is the same too: tier your thresholds by consequence, not convenience.
Three tiers work well:
-
Info / trend — logged, reviewed in the daily standup, no ping. "Completeness dipped to 96% on the parts-scan stream." Worth noticing, not worth waking anyone.
-
Warning — routed to the data owner's queue, must be acknowledged same day. "Freshness on GPS stream exceeded 30 minutes for 15+ minutes."
-
Critical — pages the on-call owner. "Arrival-event stream stopped entirely" or "billing/dispatch variance exceeded 10%." These are the ones that mean automations are actively making bad decisions.
A common mistake: teams set a single threshold on a raw number ("alert if lag > 5 min") without accounting for normal variance. Field data is bursty. Techs cluster their form submissions at lunch and end of day. A rigid threshold fires forty times a day, everyone mutes it, and then the real outage sails through unnoticed.
Better approach: threshold on sustained deviation and on rate of change, not instantaneous values. "Freshness above target for a continuous 15 minutes" beats "freshness above target right now." Where you can, base thresholds on the stream's own recent baseline rather than a static guess.
Sampling dashboards: watch a slice, not the ocean
You can't eyeball every event. At a few hundred jobs a day that's already impossible, and it gets worse fast. Sampling dashboards solve this by showing a representative slice with enough context to spot trouble.
Two sampling patterns that earn their keep:
Stratified sampling by risk. Instead of a random sample, weight toward the events that matter most—SLA-critical jobs, high-value contracts, jobs that triggered automations, and any job whose events were edited after the fact. A random sample of a thousand jobs might contain three SLA-critical ones. A stratified sample surfaces the ones where a data error actually costs money.
Anomaly-highlighted views. The dashboard shouldn't just show data—it should flag the weird stuff. Jobs where completion preceded arrival. Techs whose event lag is suddenly triple their baseline. Streams whose completeness dropped week-over-week. A good sampling dashboard is mostly normal data for context and a smaller portion of flagged outliers you actually act on.
One thing worth keeping in mind: the dashboard is for humans doing triage, not for reassurance. If your team glances at it and feels calm, it's probably too smoothed. It should occasionally make someone say "wait, why is that number like that?"
Triage playbooks: what to do when a stream goes sideways
An alert with no playbook is just anxiety. The whole trust program hinges on whoever gets paged knowing exactly what to check and in what order.
A practical triage playbook for a degraded field-event stream:
-
Confirm scope. Is it one technician, one region, one device type, or the whole stream? A single tech's dead feed is a device problem; a whole stream is an integration or pipeline problem. This first question routes everything else.
-
Check the boundary. Is the data missing at capture (mobile app), in transit (sync/integration), or at rest (your system dropped it)? Each has a different owner and a different fix.
-
Freeze dependent automations if needed. If arrival events are dead and an auto-close rule depends on them, pause that rule before it corrupts more records. This step gets skipped constantly and it's the most expensive omission.
-
Backfill or quarantine. Once flowing again, decide
can you recover the missing events (offline sync will catch up) or must you quarantine the affected window as untrustworthy for SLA reporting?
-
Log root cause and update thresholds. If this class of failure was invisible until a customer noticed, your SLIs missed it—add or tune one.
Pause auto-close rules before they corrupt more records.
Step 3 is where discipline pays off. Automations amplify data problems. A bad feed driving a smart routing rule doesn't just produce bad data—it produces bad actions in the field, real trucks going to real wrong places. Any program that governs these decisions needs guardrails, which is exactly the thinking behind treating automation and ML in field operations as something you monitor, not something you set and forget.
What breaks as you scale
At 30 jobs a day, one dispatcher notices when something looks off. Human judgment is the observability layer. That doesn't scale, and the failure is gradual enough that most operations don't realize they've outgrown it.
The progression tends to go like this:
-
Small (under ~50 jobs/day) informal. One person spots anomalies. Reconciliation is basically "the numbers looked right at month-end." Works until it doesn't.
-
Growing (50–200/day) the informal layer breaks first. Nobody can eyeball the volume. This is where silent data drift starts eating SLA credits and nobody can say when it began. Most operations discover they need a real program here, usually after a painful dispute they couldn't defend.
-
Scaled (200+/day, multiple regions/streams) now you've got multiple integrations, offline devices, IoT feeds, and subcontractor data all landing in the same lake. Consistency and reconciliation become the dominant risk. A single bad integration can corrupt automations across regions before anyone notices.
The thing most people miss: volume isn't what breaks you. It's the number of independent data sources multiplied by the number of automations depending on them. Two streams and one automation is manageable by hand. Six streams and a dozen automations is a combinatorial mess no human can watch. That's the real scaling threshold.
A real scenario
A regional HVAC service business running roughly 140–160 jobs a day had a green SLA dashboard and a growing gap they couldn't explain: finance kept clawing back "on-time" jobs at quarter-end after customers disputed them.
The root cause turned out to be freshness and consistency, not performance. Arrival events from basement and rooftop jobs were landing late because of connectivity, stamping on-time arrivals as late—and in a handful of cases, an auto-close rule was completing jobs that a stalled "work started" feed had never actually opened.
They stood up basic data SLIs (freshness and completeness per stream), a daily dispatch-vs-billing reconciliation with a morning exception queue, and a rule that paused auto-close whenever the arrival stream went stale. Within about two months, the quarter-end disputes dropped noticeably, and they recovered somewhere in the range of a few thousand dollars in credits they'd been eating on jobs that were actually compliant. The bigger win was quieter: they could finally defend their numbers in a dispute instead of guessing.
When this makes sense—and when it doesn't
When it's worth building: you've got SLA-backed contracts, multiple data sources feeding automations, or you've already lost credits or a dispute you couldn't defend with data. If automations are making field decisions off event streams, you need this before those decisions scale.
When it's overkill: a small single-crew operation with one dispatcher who genuinely sees every job. Formalizing observability there adds overhead without much return. Do the reconciliation ritual monthly and skip the rest until volume forces the issue.
Who should not start here: if your underlying data model is still a mess—inconsistent IDs, no canonical objects, conflict resolution that overwrites good data—fix that first. Observability on top of a broken model just gives you high-resolution measurements of garbage. Get the foundation right, then measure it.
The system view
A field data observability and trust program isn't a dashboard project. It's the connective tissue between your data architecture, your automations, and your SLA commitments. SLIs tell you when a stream is degrading. Reconciliation proves your numbers are real. Thresholds and triage playbooks keep the humans focused on what matters instead of drowning in noise. And guardrails on automations stop bad data from turning into bad field decisions.
The operations that get this right stop being surprised at month-end. They know their data has drifted before finance does, before the customer does, and long before it turns into a dispute. That shift—from reacting to failures to catching drift early—is the entire point. Your job KPIs tell you how the work went. Your data observability program tells you whether you can believe them.
The operations that get this right stop being surprised at month-end. They know their data has drifted before finance does, before the customer does, and long before it turns into a dispute. That shift—from reacting to failures to catching drift early—is the entire point. Your job KPIs tell you how the work went. Your data observability program tells you whether you can believe them.
Ready to optimize your field operations?
Join 2,000+ service teams using Romrly to boost productivity, reduce downtime, and enhance customer satisfaction.