


Most field service businesses don't fail because they lack talent or demand. They stall because the way they operate at 15 technicians is the same way they operated at 5 — just louder, messier, and with more fire drills. The dispatcher who used to hold everything in their head now drowns. The owner who approved every PO can't keep up. Systems that worked when everyone sat in one office crack the moment you've got three regions and 40 vans.
A maturity model gives you a way to see where you actually are, what breaks next, and what to invest in — and in what order. Not a vague "crawl, walk, run" poster on the wall, but something with gates you can measure, priorities mapped to specific roles, and 90/180/360-day checkpoints that tell you whether to keep funding the next stage or fix the current one first.
This is the framework we'd hand to an owner or ops leader who wants to grow without the operation falling apart underneath them.
Why most maturity models are useless in the field
The ones you find floating around describe states ("Level 3 = integrated systems") without telling you how to get from one to the next, who owns what, or how you'll know you actually arrived. They read like consulting slideware.
The second problem: generic models treat the business as one blob. In reality, maturity isn't uniform. Plenty of companies have surprisingly solid dispatch logic but garbage parts governance, or excellent financial controls bolted onto scheduling that still runs off whiteboards and group texts. Maturity is lumpy. A good model lets you score each dimension separately — people, process, and technology — so you stop over-investing in areas you're already decent at and ignoring the thing that's actually bleeding you.
The third problem is pacing. Businesses try to jump two stages at once, buy a platform built for a 200-tech operation, and then wonder why adoption collapses. Maturity moves at the speed of habit change, not software procurement.
The four stages, and what actually defines each one
The ladder below separates each stage not by size, but by how work gets coordinated and how decisions get made.
Eliminate field service chaos with Romrly.
Romrly helps you assign, track, and complete service jobs efficiently and on time.
- Unified job scheduling
- Technician dispatch & tracking
- Customer notifications & updates
No credit card required
| Stage | What coordination looks like | Decision-making | Typical failure mode |
|---|---|---|---|
| 1. Reactive | Tribal knowledge, texts, one person holds it all | Gut feel, owner approves everything | Owner is the bottleneck; nothing survives their vacation |
| 2. Repeatable | Written SOPs, shared schedule, defined roles | Managers decide within rules | SOPs exist but aren't followed; data entered late or not at all |
| 3. Managed | Metrics drive the day, exceptions are triaged | Decisions follow thresholds and playbooks | Dashboards exist but nobody acts on them; metric theater |
| 4. Optimized | Predictive, cross-functional, continuous improvement | Teams own outcomes, forecast-driven | Over-engineering; complexity outpaces the team that runs it |
A quick gut-check for where you sit: if your best dispatcher quit tomorrow, how long until the wheels come off? Stage 1, it's days. Stage 2, a couple weeks of friction. Stage 3, you'd notice but survive. Stage 4, the system absorbs it.
Most owners think they're a stage higher than they are because they have the tools associated with the next stage. Owning a scheduling platform doesn't make you Managed. Acting on what it tells you does.
Scoring where you really are
Before any roadmap, you need an honest baseline across three dimensions. Rate each one 1–4 using the stage definitions above. Don't average them into a single number — you'll hide the weak link.
People signals
-
Are roles clearly defined, or does everyone do a bit of everything?
-
Can a new dispatcher or tech be productive without shadowing one specific person for weeks?
-
Is there a career path, or do people leave when they hit the ceiling?
Process signals
-
Is work intake standardized, or does it come in five different ways?
-
Do SOPs exist and get followed under pressure?
-
Are exceptions (emergencies, failed jobs, parts shortages) handled by rule or by whoever's loudest?
Technology signals
-
Is data entered at the point of work, or reconstructed later from memory?
-
Do your systems talk to each other, or does someone retype invoices into accounting?
-
Can you pull a number like first-time-fix rate without a half-day of spreadsheet surgery?
A common pattern: a company scores Process at 3 but People at 1.5. They've written detailed SOPs, but nobody's actually accountable for enforcing them, so the documents gather dust. That gap tells you exactly where the next dollar goes — not more process documentation, but an owner for it.
The gated roadmap: 90 / 180 / 360 per stage
Each stage transition gets a 90/180/360-day plan with gates — measurable conditions you must hit before funding the next push. Gates stop you from declaring victory on vibes.
Stage 1 → Stage 2 (Reactive to Repeatable)
-
Document the top 10 recurring job types as basic SOPs
-
Define four core roles clearly
who schedules, who dispatches, who closes jobs, who handles parts
-
Move scheduling off texts and whiteboards onto one shared source of truth
Gate: every active job is visible in one place that isn't someone's phone. If the answer to "where's that job?" is still "let me text the guy," you haven't passed.
-
Standardize job intake into a single channel
-
Techs capture job completion data in the field, same day, not from memory
-
Weekly ops review happens on a fixed cadence
Gate: at least 80% of jobs closed with complete data on the day of service.
-
SOPs cover the majority of job volume
-
The owner can take a week off without the operation stalling
Gate: owner steps away for five business days and nothing catastrophic happens. This is the real test of Stage 2.
Stage 2 → Stage 3 (Repeatable to Managed)
-
Define a handful of metrics that matter by role — not a wall of 40 KPIs. Our field service KPI framework breaks down which metrics each role should actually own so dashboards don't become wallpaper.
-
Establish thresholds that trigger action (e.g., first-time-fix drops below X → review)
Gate: each role can state their two or three numbers without looking them up.
-
Exception handling moves from improvisation to defined playbooks
-
Parts and inventory get governance, not guesswork
-
Capacity planning becomes a weekly discipline, not a Monday panic
Gate: 70%+ of common exceptions handled by playbook without escalating to the owner.
-
Metrics reviewed and acted on at every level, weekly
-
Cross-functional issues (ops vs. finance vs. parts) have an owner and a cadence
Gate: you can point to three operational decisions in the last quarter that were made because of a metric, with the outcome tracked.
Stage 3 → Stage 4 (Managed to Optimized)
-
Historical data clean enough to forecast demand and parts needs
-
Integration between core systems so data flows without retyping. If you're still stitching tools together manually, our piece on field service technology standards for scalable integrations covers how to set that foundation properly.
Gate: no manual re-entry of the same data into two systems.
-
Predictive maintenance and demand forecasting inform scheduling
-
Continuous improvement loop
issues feed back into SOPs automatically
Gate: forecast accuracy good enough that you're pre-positioning parts and crews, not reacting.
-
Teams own outcomes, not just tasks
-
The system surfaces problems before customers do
Gate: measurable reduction in emergency and reactive work as a share of total volume.
The progression from Stage 3 to Stage 4 is slower than it looks on paper. Most companies underestimate how long it takes for forecasting to become reliable enough to actually trust, and how much cleaner your historical data needs to be before any of it is useful.
Here's a simple visualization of how the gated 90/180/360 roadmap flows between stages and roles.
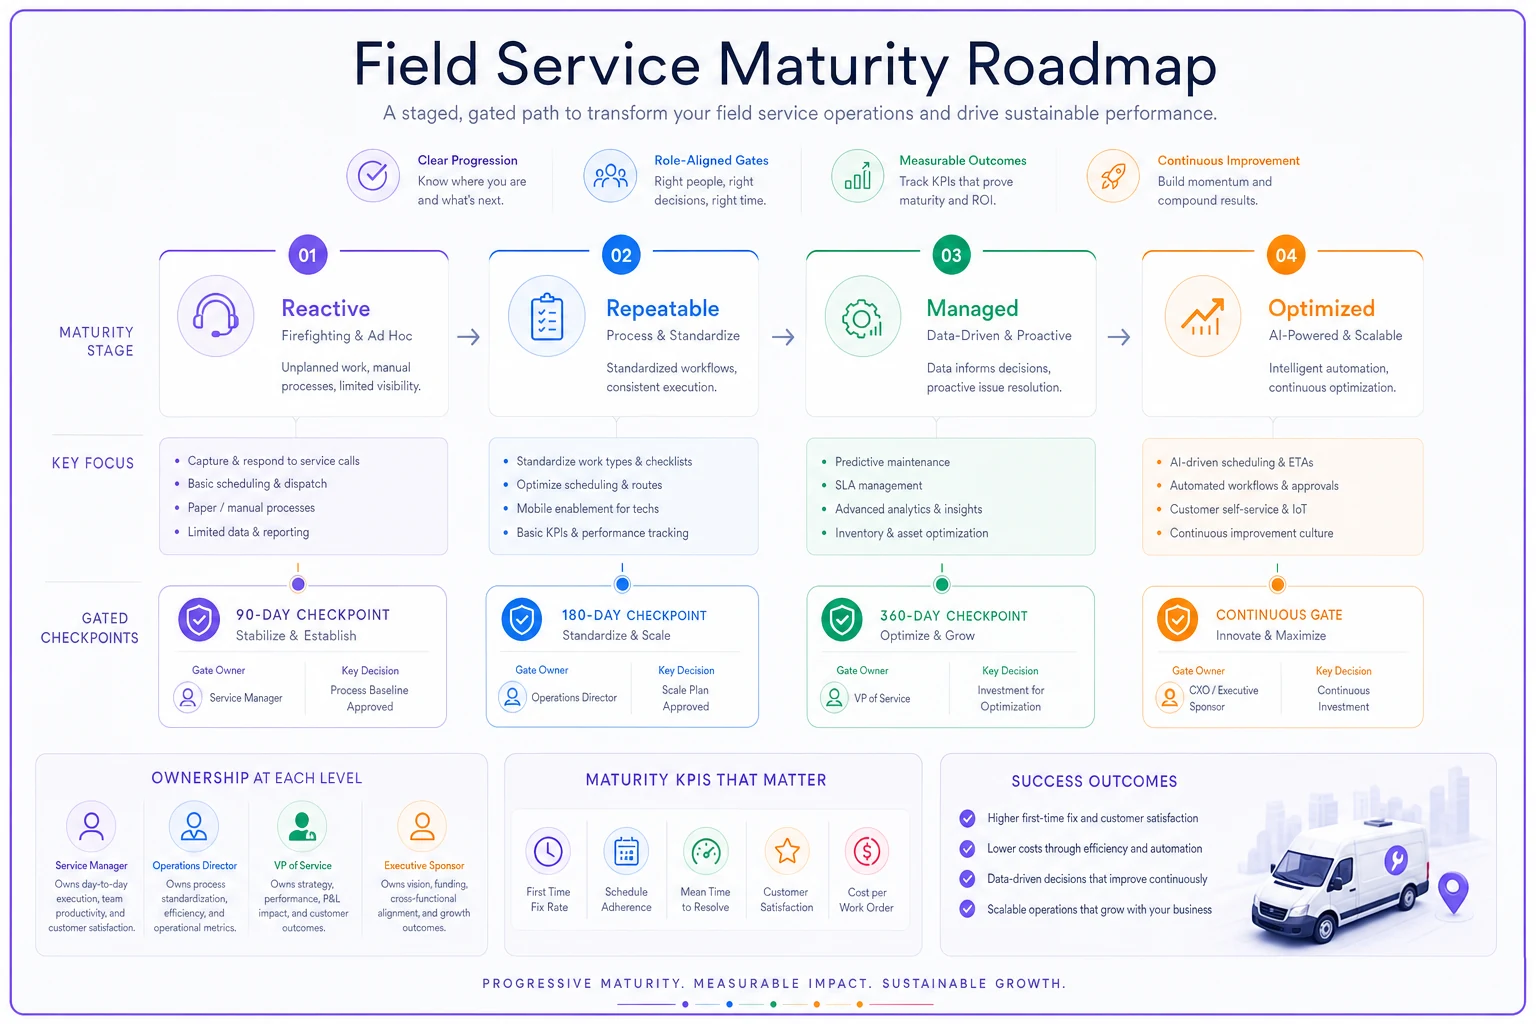
Start funding the next stage only when the measurable gate is green — not when the dashboard looks better on a demo.
Each stage's gates force discipline: define the condition, name the owner, and only then release budget for the next set of changes.
Mapping priorities to roles, not just to the company
A roadmap without named owners is a wish list. Here's how the work splits by role as you climb:
-
Owner / GM — Early stages
stop being the bottleneck, delegate decisions, fund the right gate. Later stages: set thresholds, protect the improvement budget, resist the urge to re-centralize when things get tense.
-
Operations / Service Manager — Owns the process backbone. SOP enforcement in Stage 2, metric-driven triage in Stage 3, forecast-driven planning in Stage 4.
-
Dispatcher / Planner — Early
get everything into one visible system. Later: work by exception and threshold instead of handling every job personally.
-
Lead Technicians — Own field data quality and feed real-world knowledge back into SOPs and job guides.
-
Finance / Admin — Early
clean invoicing and job closeout. Later: per-job profitability visibility and tying operational metrics to margin.
The mistake that shows up constantly: the owner buys technology for Stage 3 but never reassigns the people responsibilities, so the dispatcher is now expected to run exception playbooks on top of still manually scheduling every job. The role map has to shift with the tech, or the tech just adds load.
A real scenario
A regional HVAC and refrigeration company — around 22 technicians, three dispatchers, mostly commercial contracts — sat firmly at Stage 1.5. SOPs existed in a binder nobody opened. Scheduling lived across a shared calendar, a text thread, and the owner's memory. First-time-fix was somewhere around 68%, and roughly a quarter of jobs needed a return trip for parts or missing info. The owner was approving every purchase order and fielding dispatch questions at 9 PM.
They ran the baseline and scored People 2, Process 2, Technology 1. The weak link was obvious: data never got captured at the point of work, so nothing downstream could improve.
They committed to the Stage 1→2 gates first — resisting the temptation to buy a big platform. First 90 days: got every job onto one shared schedule and defined who owned what. Next 90: techs started closing jobs same-day in the field with required fields. By month seven, same-day complete data was running north of 80%.
Results weren't dramatic overnight, but they compounded. First-time-fix climbed into the high 70s because dispatchers could actually see parts history before sending someone out. Return trips dropped by roughly a third. The owner stopped being the escalation point for routine decisions and took his first real week off in four years without the business seizing up. Only then did they start the Stage 2→3 work on metrics and thresholds. Trying to do that a year earlier would have been metric theater on top of bad data.
When climbing a stage is a bad idea
Not every business should push for Stage 4, and plenty shouldn't rush even to Stage 3.
-
If your data is dirty, don't buy predictive anything. Forecasting on garbage produces confident garbage. Fix capture first.
-
If your team is already underwater, don't add process. Stabilize headcount and workload before layering on new disciplines nobody has time to follow.
-
If you're a small, stable, owner-run shop with happy customers and no growth ambition — Stage 2 might be exactly right. The cost and complexity of Stage 4 only pays off when scale and volatility justify it. Over-engineered small operations collapse under systems built for companies three times their size.
-
If you can't name who owns the next gate, you're not ready to start it.
Maturity is a tool for deciding where the next dollar and the next hour go. Skipping stages almost always means paying for capability your team can't absorb yet.
Turning this into an investment-backed plan
The reason to gate everything is that it makes the roadmap fundable — by you, a lender, or an investor. Each gate is a milestone with a measurable condition, which means you can tie spend to proof. You don't release the Stage 3 budget until the Stage 2 gates are green. That discipline is what separates companies that grow profitably from ones that buy their way into chaos.
When you're ready to roll any of this out across the team, the mechanics of pilot-then-scale matter as much as the plan itself. Our field service adoption playbook covers the stakeholder mapping and KPI gates that keep a rollout from dying in the "we tried it for two weeks" graveyard.
-
[ ] Scored all three dimensions honestly, separately
-
[ ] Identified your actual weakest link (not your loudest complaint)
-
[ ] Picked the one stage transition to focus on next
-
[ ] Named an owner for each gate
-
[ ] Defined the measurable condition for each 90/180/360 checkpoint
-
[ ] Agreed that the next budget doesn't release until the current gates are green
Getting through this checklist honestly — without rationalizing a shortcut — is harder than it sounds. Most teams get stuck on the second item because the loudest complaint and the actual weak link are almost never the same thing.
The real point
The value of a maturity model isn't the labels. It forces honesty about where coordination breaks today, sequences investments so they build on each other, and stops you from confusing new software with actual operational capability. A field service business grows in layers — people, then process, then technology, then back to people as roles evolve. Rush a layer and the ones underneath buckle.
Score yourself this week. Find the lumpy part. Pick one gate. That's the whole game.
Ready to optimize your field operations?
Join 2,000+ service teams using Romrly to boost productivity, reduce downtime, and enhance customer satisfaction.